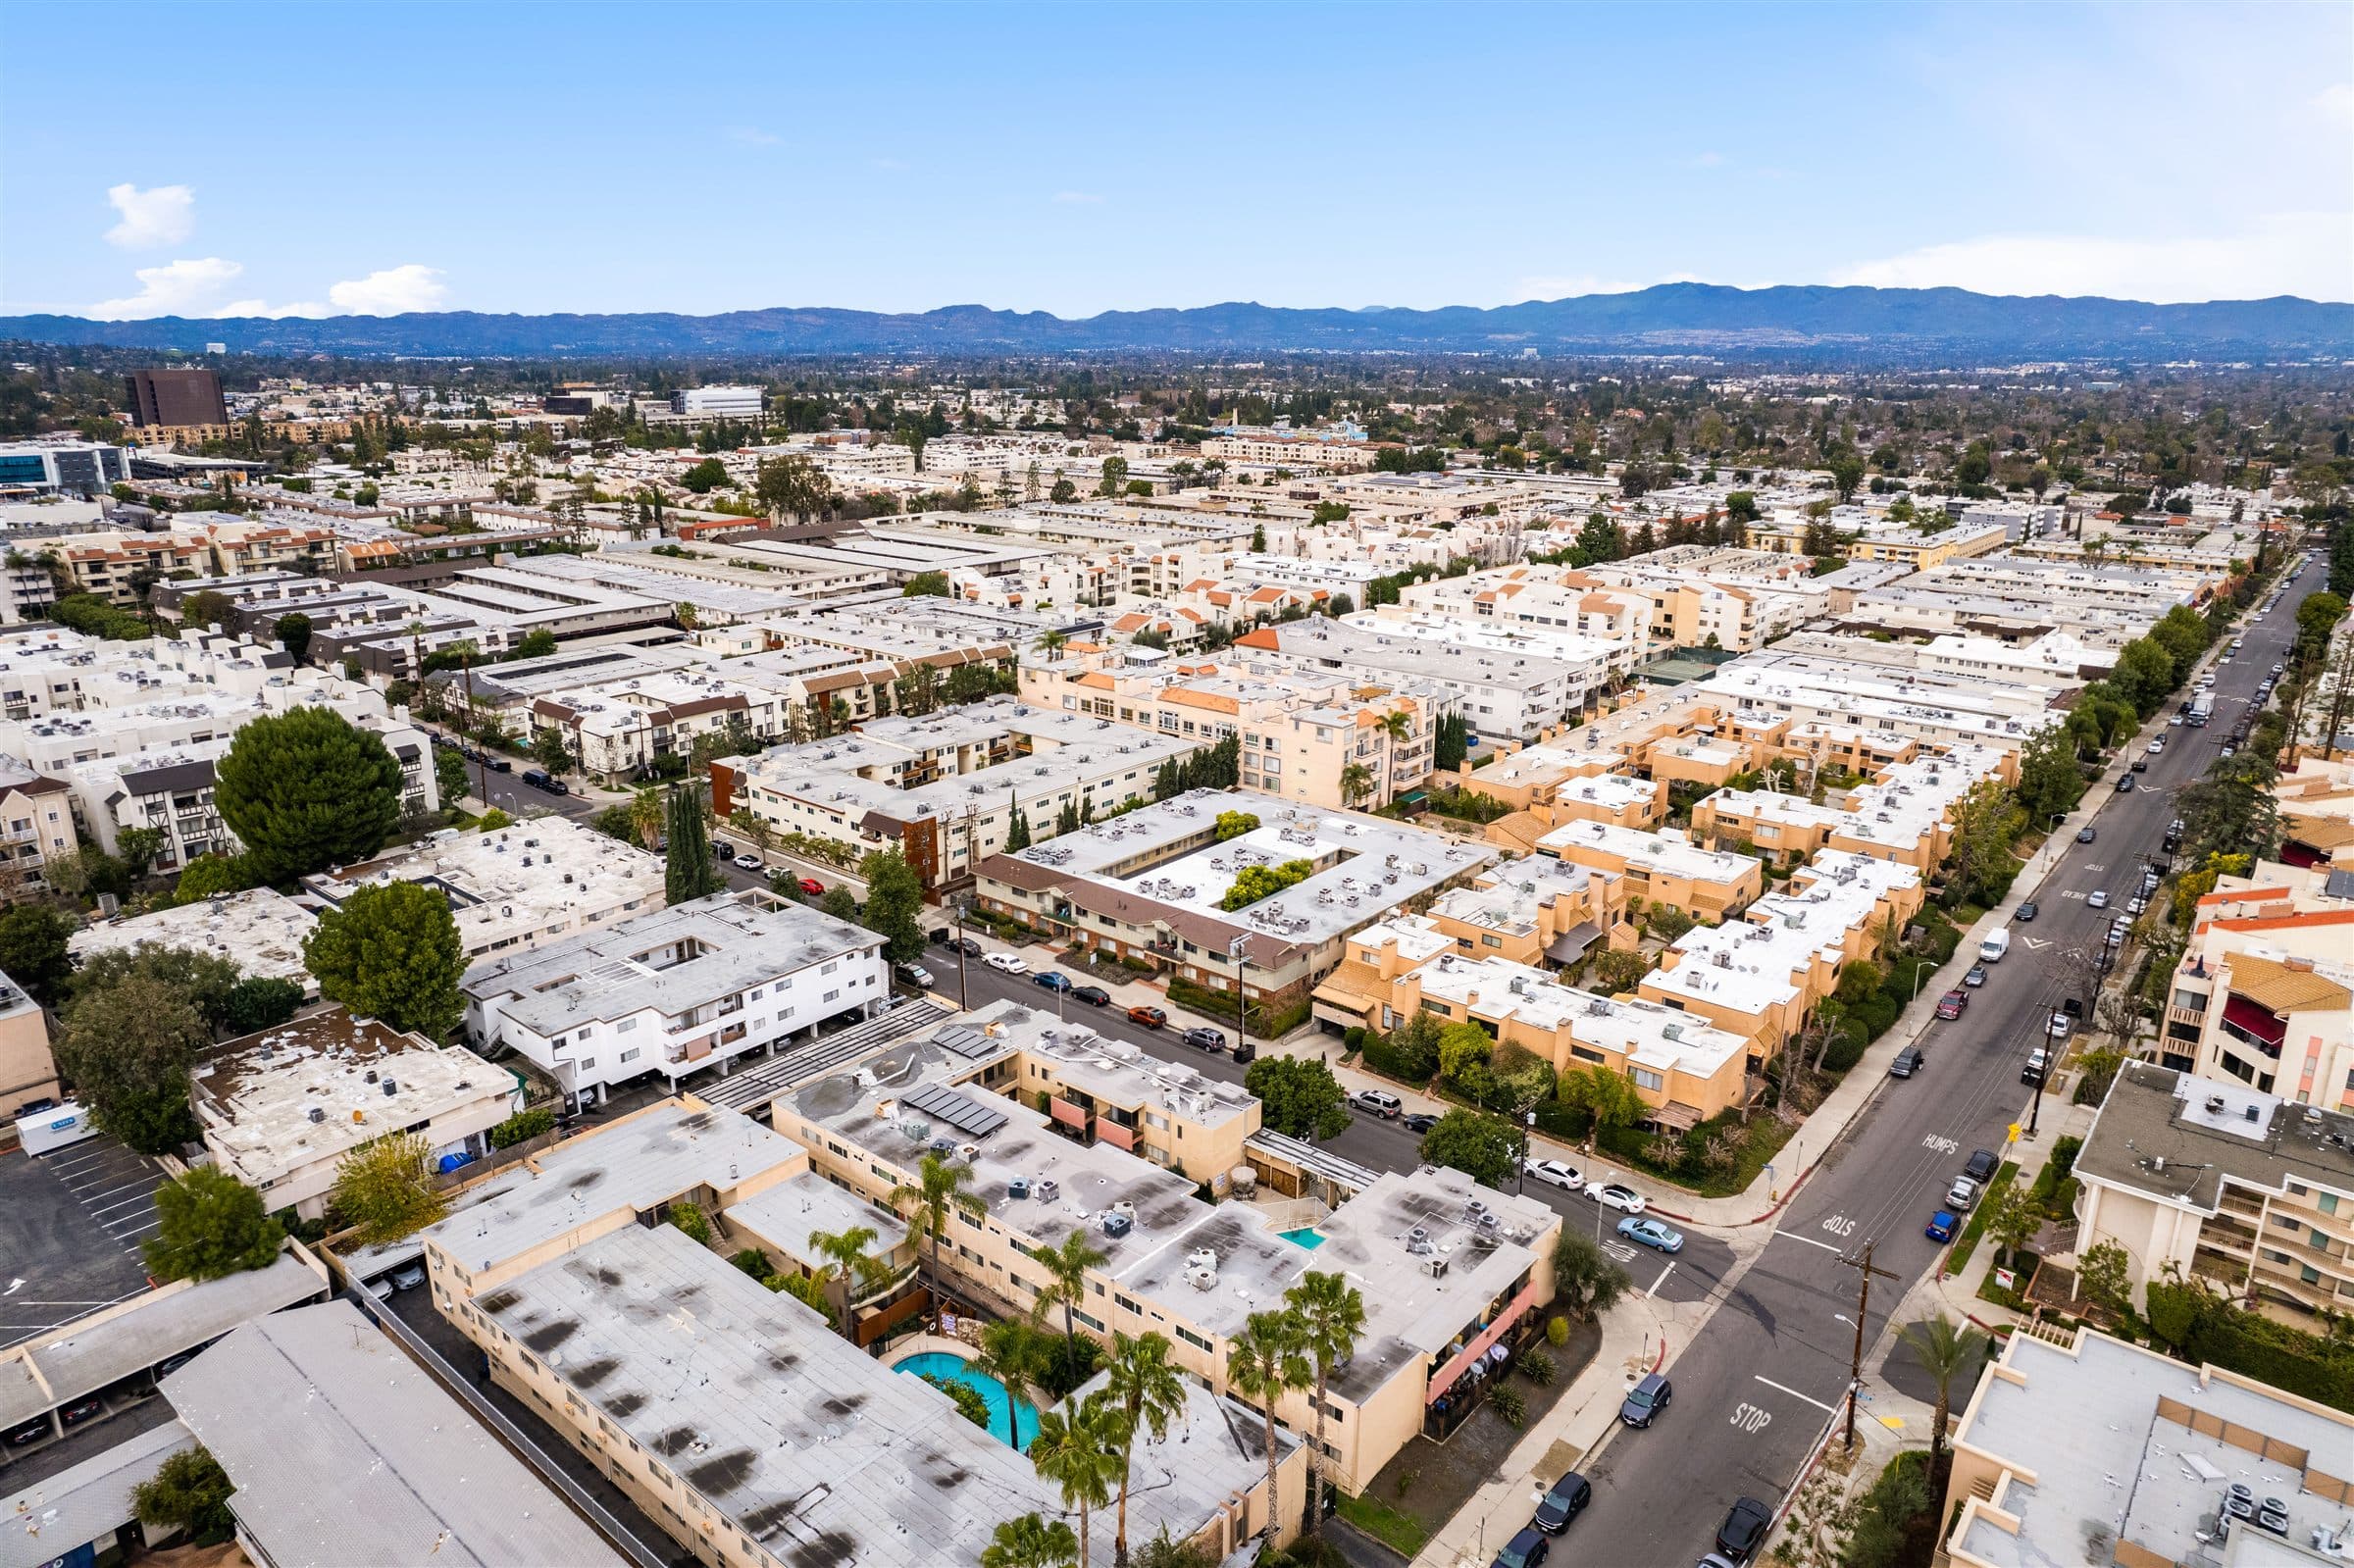
Los Angeles Apartment Building and Land Investment Sales
Buying, selling, or exploring the market. We help LA property owners make confident investment decisions.
495+
Transactions Closed
$1.55B+
Sales Volume
4,700+
Units Sold
CoStar Verified
#1 in Multifamily Transactions — Los Angeles County
Trailing 3 Years — Listing Agent & Buyer's Agent Rankings
53+
Deals in Last 24 Months
38%
Apartments Sold Under 30 Days
56
Consecutive Quarters With a Closing
96.7%
Apartment Pricing Accuracy
How We Sell Your Building
A proven 4-step process that creates competition and drives the highest price.
Price It Right
Our AI queries 16 government databases in parallel: zoning, permits, code violations, rent control status, flood zones, and demographics. All before your first meeting.
- Pricing backed by codified benchmarks from 495+ closed transactions
- 60,000+ buildings tracked across LA and Ventura counties
- Data-driven valuations, not guesswork
Maximum Exposure
Every listing gets multi-channel marketing to thousands of qualified buyers, starting the day it goes live.
- 100+ targeted buyer calls to 1031 exchangers, recent purchasers, and local owners
- 36,000+ owner and investor contacts built since 2012
- Premium placement on CoStar, LoopNet, Crexi, MLS, Redfin, and Marcus & Millichap
- Professional drone + ground photography. Confidential marketing available.
Negotiate the Best Deal
We create competitive bidding among buyers. That's how sellers get the highest price.
- Offer matrix comparing all offers side-by-side
- Buyer vetting and proof of funds verification
- Every offer evaluated on price, terms, contingencies, and certainty of close
Close with Confidence
Transparent communication and hands-on management from listing to closing.
- Escrow timeline management and due diligence packaging
- 1031 exchange coordination — 100+ exchanges facilitated
- Weekly Marketing Updates with calls, emails, tours, and candid buyer feedback
495+ Transactions Across Los Angeles
Apartment buildings, development land, NNN investments, and commercial properties since 2012.
Featured Closings
Select transactions from $1.55B+ in total sales volume


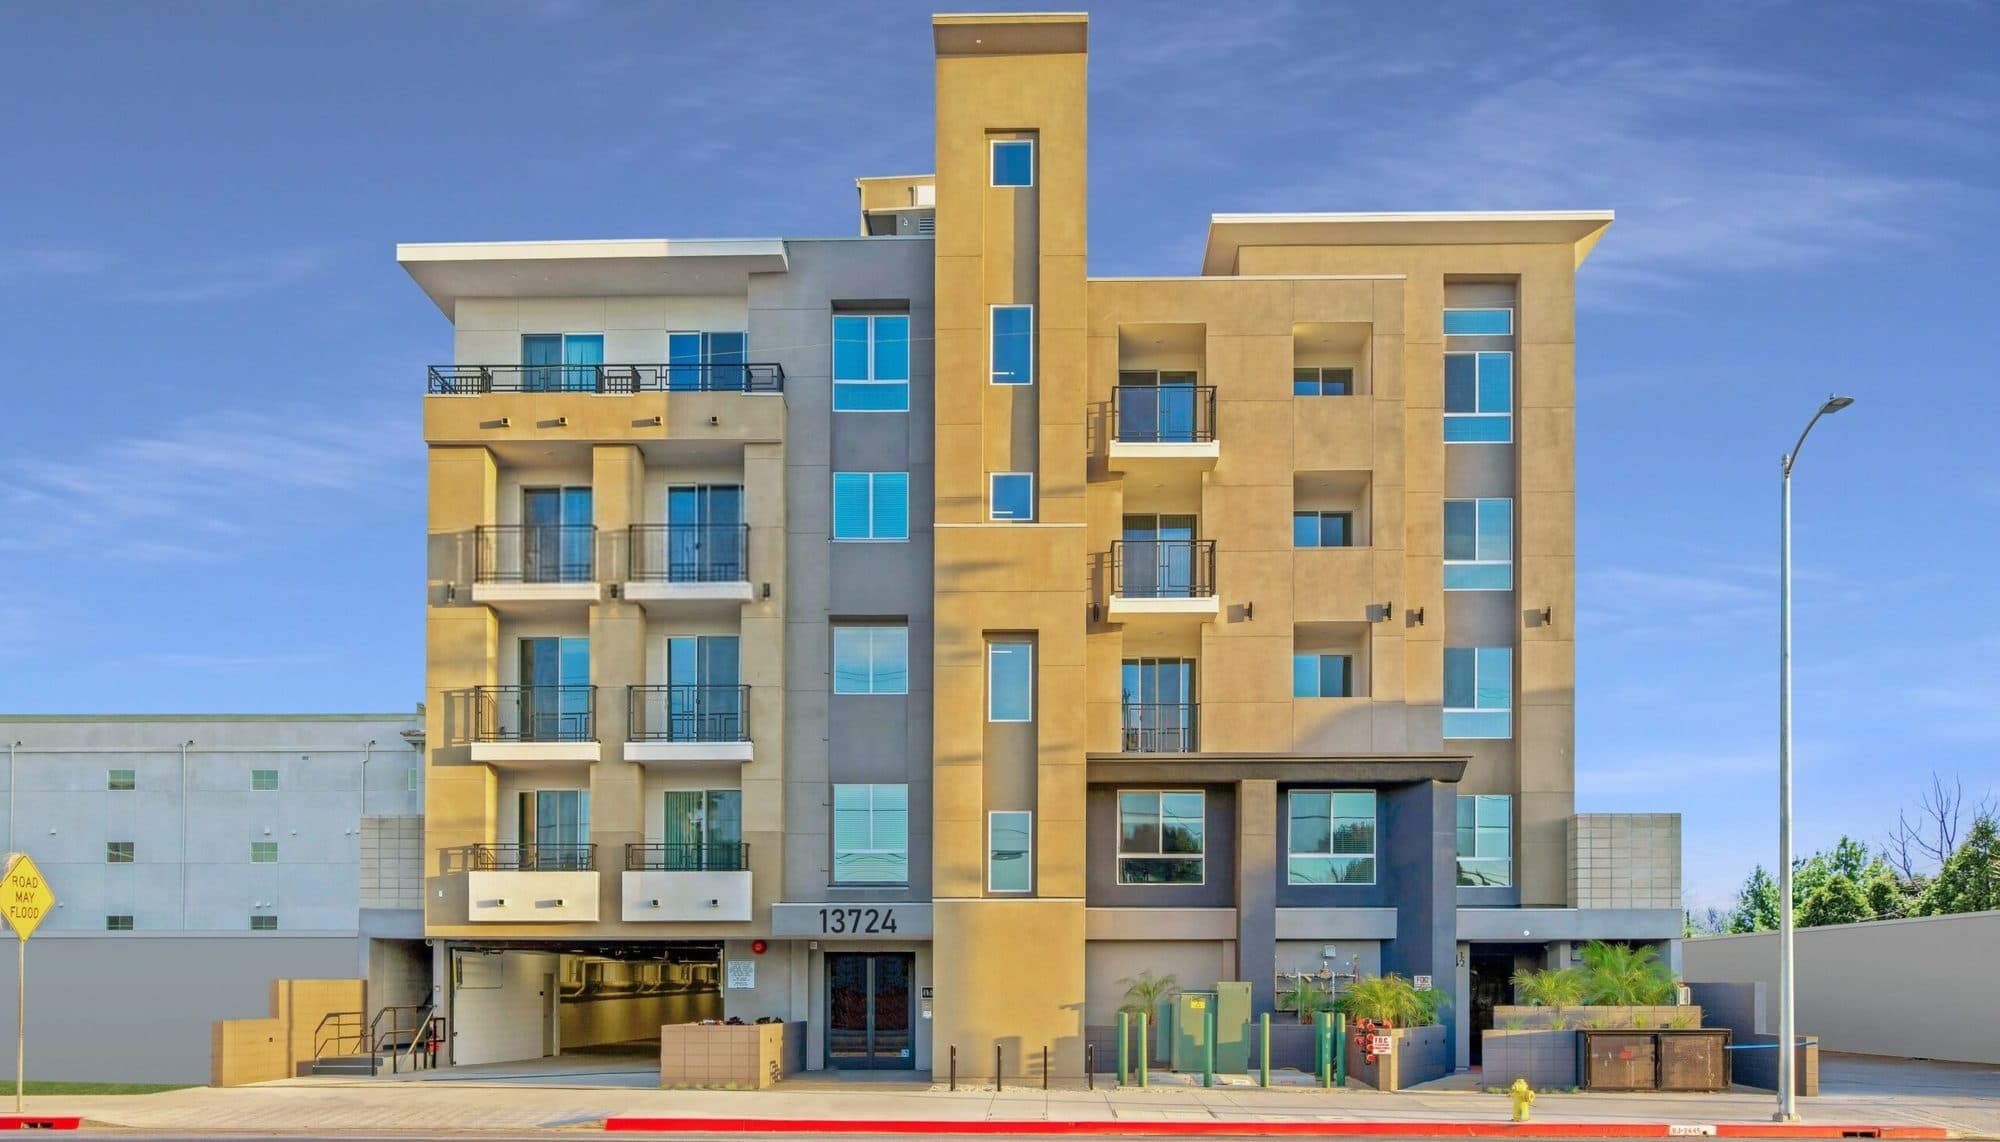


Active Land & Development


Guides & Market Insights
Expert analysis for LA apartment building investors and owners
For Sellers
For lenders, receivers, and special-assets teams: Lender-Owned & Receivership Sales
View All Guides →What Our Clients Say
“We first spoke with Filip in 2012 through a cold call. Over the next 13 years, the team stayed in regular contact with market updates. When we were finally ready to sell in 2025, there was no question who to hire. They generated five offers before the property even went live.”
Seller, 6716 Sylmar Ave, Van Nuys
12 Units | $3,500,000 | 13-Year Relationship
“The LAAA Team represented us as buyers on a rare 14-unit building in Playa Del Rey, only the sixth multifamily sale in the entire neighborhood in three years. The property hadn't traded since 1962. They navigated a complex negotiation and helped us secure a generational asset.”
Buyer, 7749 St Bernard St, Playa Del Rey
14 Units | $4,380,000 | Buyer Representation
What's Your Property Worth?
Get a free, confidential valuation from LA's most active multifamily team.
16830 Ventura Blvd, Ste. 100, Encino, CA 91436 | (818) 212-2808
Frequently Asked Questions About LA Multifamily Investing
Los Angeles has a permanent housing shortage, strong rental demand driven by population density and job growth, and limited new supply due to high construction costs and regulatory barriers. These fundamentals support stable occupancy rates and long-term rent growth for multifamily investors.
Cap rates for LA apartment buildings typically range from 4.0% to 6.5% depending on location, building age, unit count, and rent control status. RSO buildings in prime Westside locations trade at lower cap rates (4.0-5.0%), while value-add properties in emerging neighborhoods can reach 5.5-6.5%.
Los Angeles has two main rent regulation frameworks: the City's RSO (Rent Stabilization Ordinance, for buildings with a certificate of occupancy before October 1978) and statewide AB 1482 (rent caps and just-cause protections for most apartment buildings more than 15 years old). LA County's separate RSTPO applies only in unincorporated county areas. Rent-controlled buildings are valued based on current and projected allowable rent increases, vacancy decontrol potential, and operating expense ratios.
Glen Scher, Filip Niculete, and the LAAA Team at Marcus & Millichap have closed 495+ transactions totaling over $1.55B+ in sales volume since 2012. Our 8 investment professionals, backed by 3 support staff, cover all of Los Angeles County, with particular depth in the San Fernando Valley, Westside, Koreatown, and Hollywood submarkets.
The ULA (United to House LA) transfer tax, also known as Measure ULA, imposes a 4% tax on property sales over $5,400,000 and under $10,900,000, and a 5.5% tax on sales of $10,900,000 or more, within the City of Los Angeles (thresholds effective July 1, 2026, CPI-indexed annually from the original $5,000,000/$10,000,000). This additional cost significantly impacts transaction economics and has led many owners to explore 1031 exchanges, installment sales, or entity-level transfers as alternatives.
The typical marketing period for a well-priced LA apartment building is 60-120 days from listing to accepted offer, with an additional 30-60 day escrow period. Total timeline from listing to closing is usually 3-6 months. Factors affecting timeline include pricing, property condition, rent roll strength, and market conditions.
We are proactive marketers, not reactive. For every listing, we call 100+ probable buyers directly, including 1031 exchange buyers, recent purchasers, and local apartment building owners. Our 36,000+ contact database with 23,500+ active email subscribers instantly exposes your property to thousands of investors and brokers simultaneously, creating competition among buyers. Every listing receives premium placement on CoStar, LoopNet, Crexi, MLS, Redfin, and Marcus & Millichap, averaging 10,000+ views per property.
Return on Equity (ROE) measures how hard your current equity is working. If you bought a building for $500,000 that is now worth $1.5M and generates $50,000/year in cash flow, your ROI appears to be 10%, but your ROE is only 3.33%. Many long-term apartment owners have significant equity earning below-market returns. A 1031 exchange can redeploy that equity into higher-yielding investments, with our clients averaging a 75% increase in net cash flow post-exchange across our 25 documented case studies.
No. We never put for sale signs on apartment buildings and we never hold open houses. Selling multifamily investment properties is fundamentally different from selling single-family homes. The buyer pool is smaller, more targeted, and investor-based. We proactively reach buyers through direct outreach and our 36,000+ contact database. We also minimize disruption to tenants throughout the entire marketing and sale process.
On our on-market multifamily listings from 2019 through mid-2022, sellers achieved an average 97% of list price and about 1 in 5 sold at or above asking, with a median 18 days from listing to open of escrow and 3.5 signed offers per listing. Across all 340 apartment sales since 2012, our final asking price averages 96.7% of the original list price, and our median time from listing to accepted offer is 34 days. These results reflect our proactive marketing approach and deep buyer relationships.