San Fernando Valley Apartment Building Sales
Explore 206 closed multifamily transactions totaling $794.18M in the San Fernando Valley market. Data from the LAAA Team at Marcus & Millichap.
Request Free Valuation206
Transactions
$794.18M
Total Volume
4.58%
Avg Cap Rate
$282,797
Avg $/Unit
15
Avg Units
2013
Since
LAAA Team Track Record Since 2013
San Fernando Valley Multifamily Market Overview
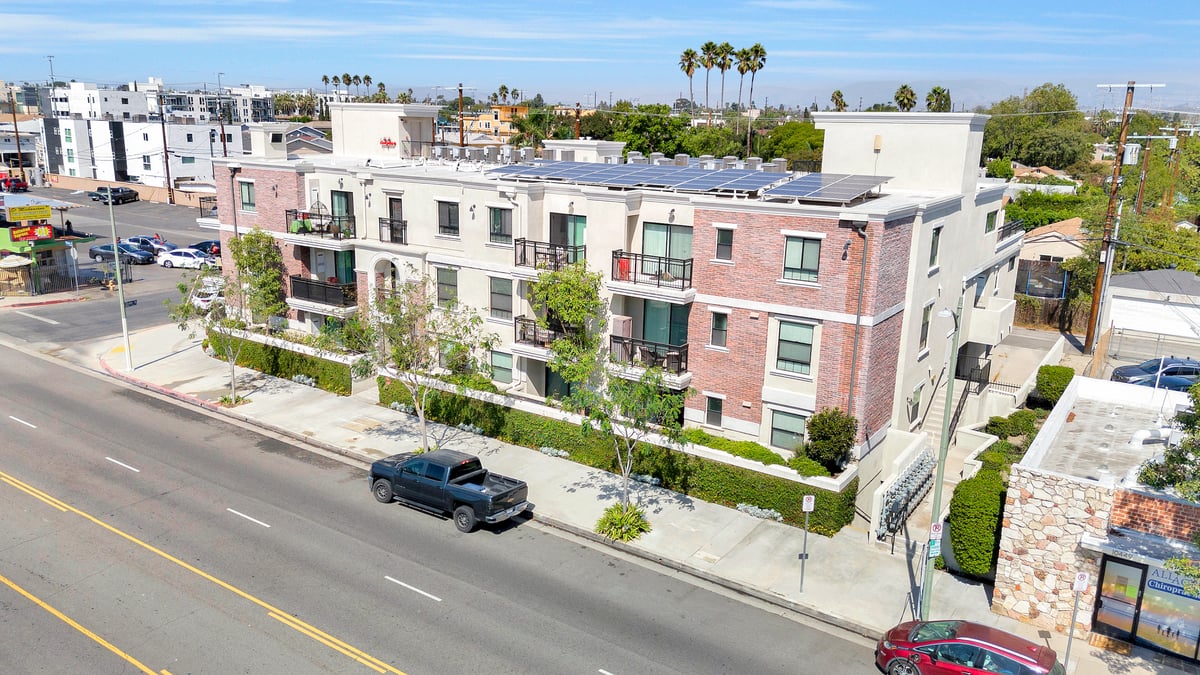
The San Fernando Valley is the largest and most active multifamily investment market in Los Angeles, stretching from Burbank and Toluca Lake on the east to Woodland Hills and Canoga Park on the west. With 203 closed transactions totaling more than $788M in sales volume, the LAAA Team has deeper transactional experience in the Valley than any competing brokerage team.
Van Nuys anchors the central Valley market along Van Nuys Boulevard and Sherman Way, where 1960s and 1970s garden-style apartment buildings trade consistently between $200K and $280K per unit. The NoHo Arts District and surrounding North Hollywood neighborhoods along Lankershim Boulevard and Magnolia Boulevard have seen accelerating rent growth since Metro B Line connectivity brought new demand to the area, pushing average cap rates to 4.24% across 40 closed deals.
Sherman Oaks commands premium pricing along Ventura Boulevard and south of the Boulevard toward Moorpark Street, where well-maintained buildings in the Sherman Oaks zip codes (91403, 91423) routinely achieve $330K+ per unit. Valley Village, tucked between North Hollywood and Studio City along Colfax Avenue and Riverside Drive, has emerged as one of the Valley's strongest value-add markets with an average cap rate of 4.26% across 14 transactions.
The western Valley corridor from Reseda through Canoga Park offers higher-yield investment opportunities, with Canoga Park averaging 5.17% cap rates and Northridge averaging 4.92% across 11 deals each. These neighborhoods along Saticoy Street, Sherman Way, and Roscoe Boulevard provide accessible entry points for investors seeking stronger cash flow positions.
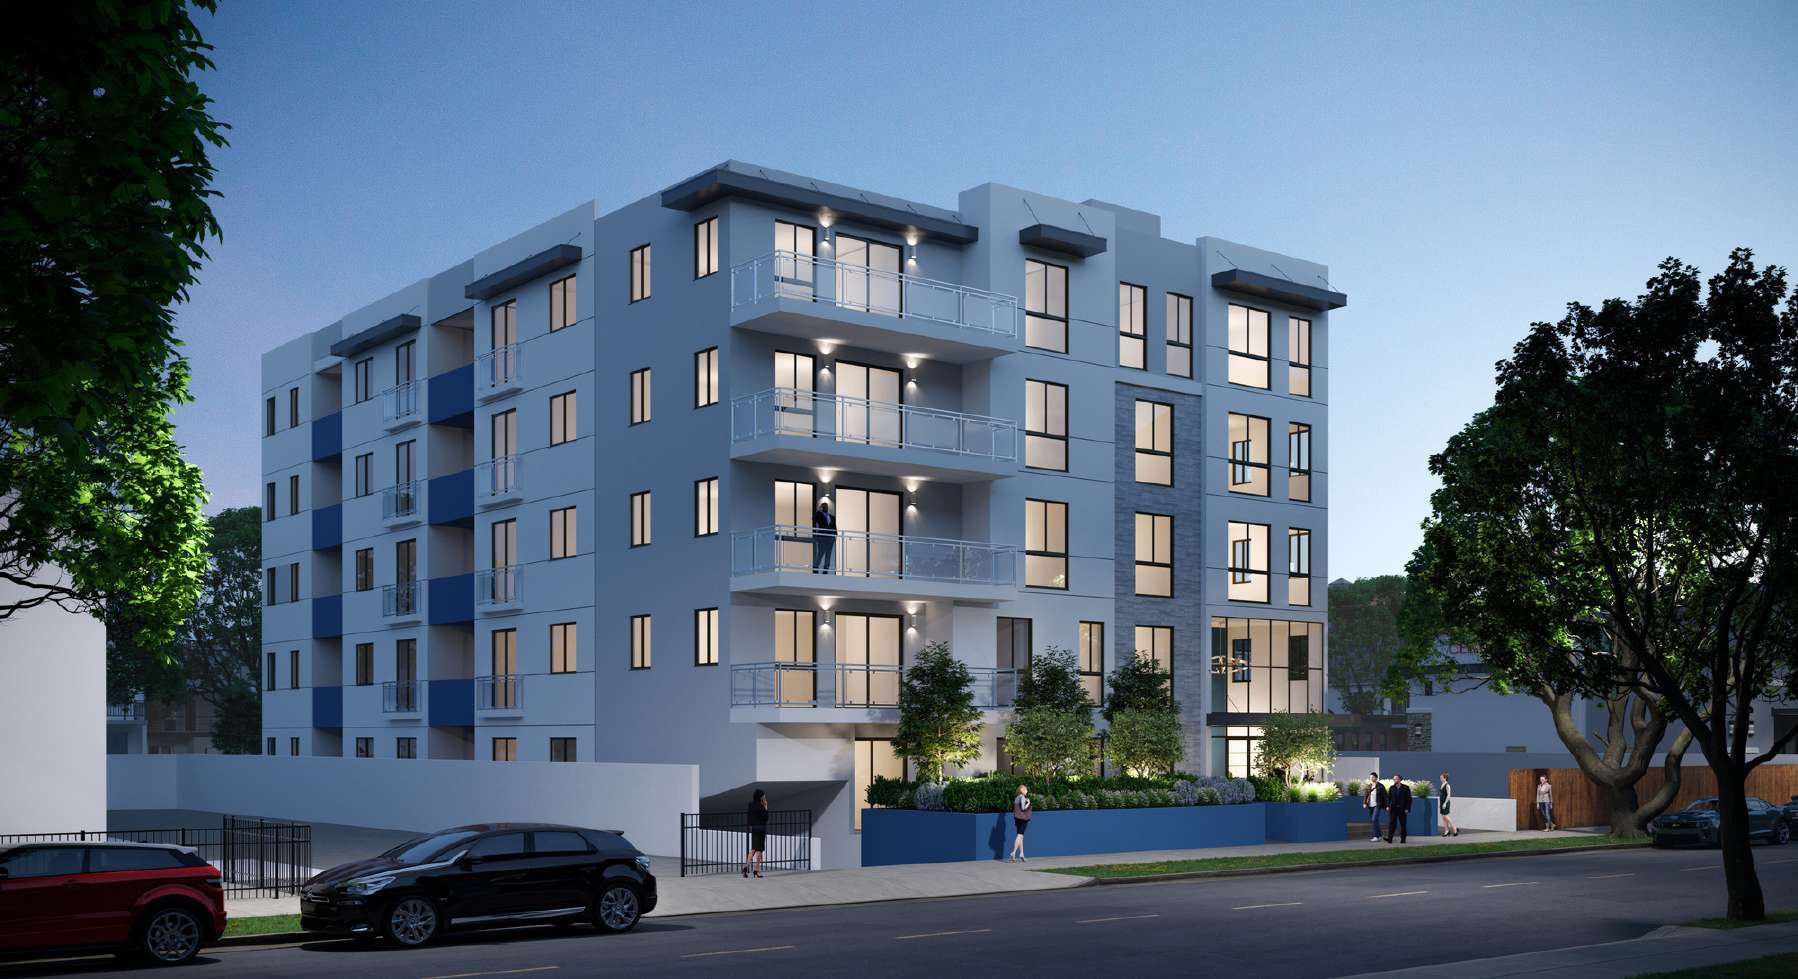
Most Valley apartment buildings fall under the Los Angeles RSO (Rent Stabilization Ordinance), which applies to buildings with two or more units built before October 1, 1978. The Valley's building stock is predominantly Type V wood-frame construction from the 1960s and 1970s, with typical unit sizes of 500-750 square feet for one-bedrooms and 750-1,000 square feet for two-bedrooms. Value-add strategies center on interior renovations to capture the $200-$400 per month rent premiums available in most Valley submarkets.
Market Snapshot
Source: CoStar | San Fernando Valley Multifamily | 2026 Q1Rents by Unit Type
Investment Activity (Trailing 12 Mo)
City Breakdown
Van Nuys
42$117.87M volume
Avg cap: 4.91%
Avg $/unit: $245,328
View City →
North Hollywood
41$107.21M volume
Avg cap: 4.29%
Avg $/unit: $313,856
View City →
Sherman Oaks
28$101.22M volume
Avg cap: 4.06%
Avg $/unit: $333,382
View City →
Valley Village
14$48.27M volume
Avg cap: 4.26%
Avg $/unit: $394,224
View City →
Northridge
11$55.83M volume
Avg cap: 4.92%
Avg $/unit: $173,051
View City →
Canoga Park
10$29.36M volume
Avg cap: 5.32%
Avg $/unit: $184,383
View City →
Studio City
8$54.27M volume
Avg cap: 3.88%
Avg $/unit: $391,509
View City →
Tujunga
6$40.05M volume
Avg cap: 4.42%
Avg $/unit: $262,305
View City →
Reseda
6$36.75M volume
Avg cap: 4.06%
Avg $/unit: $255,739
View City →
North Hills
6$24.72M volume
Avg cap: 6.55%
Avg $/unit: $350,228
View City →
Winnetka
5$32.73M volume
Avg cap: 5.14%
Avg $/unit: $170,544
View City →
Pacoima
4$4.90M volume
Avg cap: 5.41%
Avg $/unit: $115,893
View City →
Panorama City
4$21.74M volume
Avg cap: 5.39%
Avg $/unit: $204,875
View City →
Sylmar
3$18.50M volume
Avg cap: 4.21%
Avg $/unit: $223,390
View City →
Woodland Hills
3$17.22M volume
Avg cap: 4.53%
Avg $/unit: $381,563
View City →
Granada Hills
3$21.58M volume
Avg cap: 4.20%
Avg $/unit: $296,410
View City →
Toluca Lake
2$2.75M volume
Avg cap: 4.27%
Avg $/unit: $308,750
Encino
2$7.65M volume
Avg cap: 4.12%
Avg $/unit: $290,476
Chatsworth
2$19.45M volume
Avg cap: 4.38%
Avg $/unit: $295,834
Lake Balboa
1$1.72M volume
Avg cap: 5.73%
Avg $/unit: $245,000
Santa Clarita
1$1.82M volume
Avg cap: 5.32%
Avg $/unit: $202,778
Mission Hills
1$4.81M volume
Avg cap: 4.45%
Avg $/unit: $267,222
West Hills
1$19.95M volume
Avg cap: 4.67%
Avg $/unit: $511,538
Arleta
1$2.90M volume
Avg cap: 5.12%
Avg $/unit: $120,833
San Fernando
1$925,000 volume
Avg cap: 6.87%
Avg $/unit: $92,500
San Fernando Valley Market Area
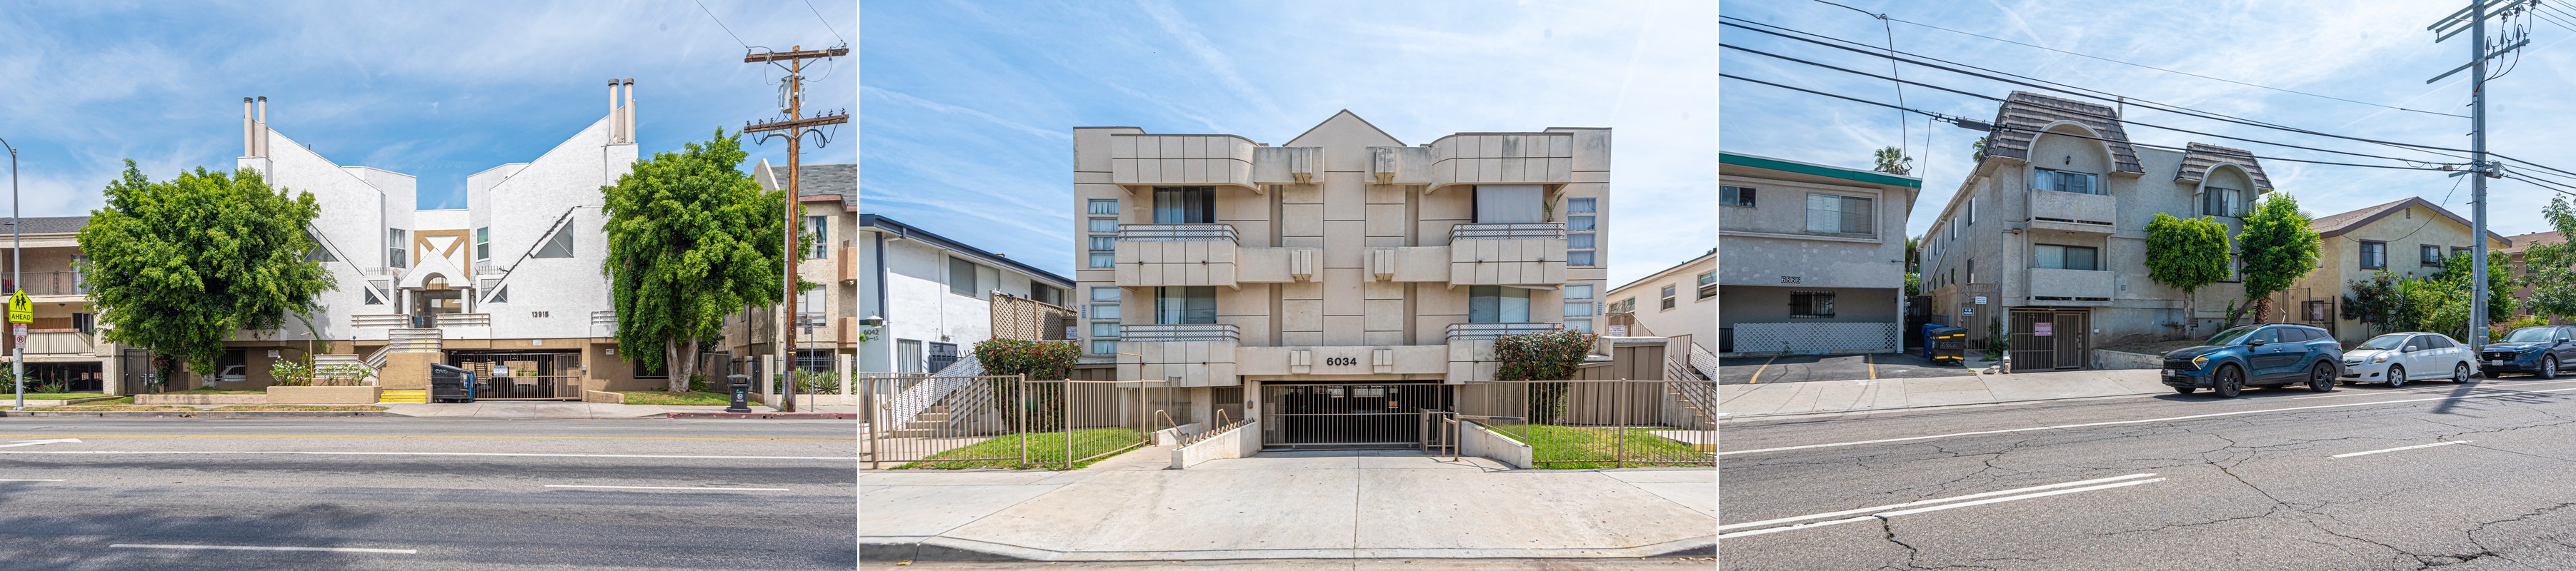
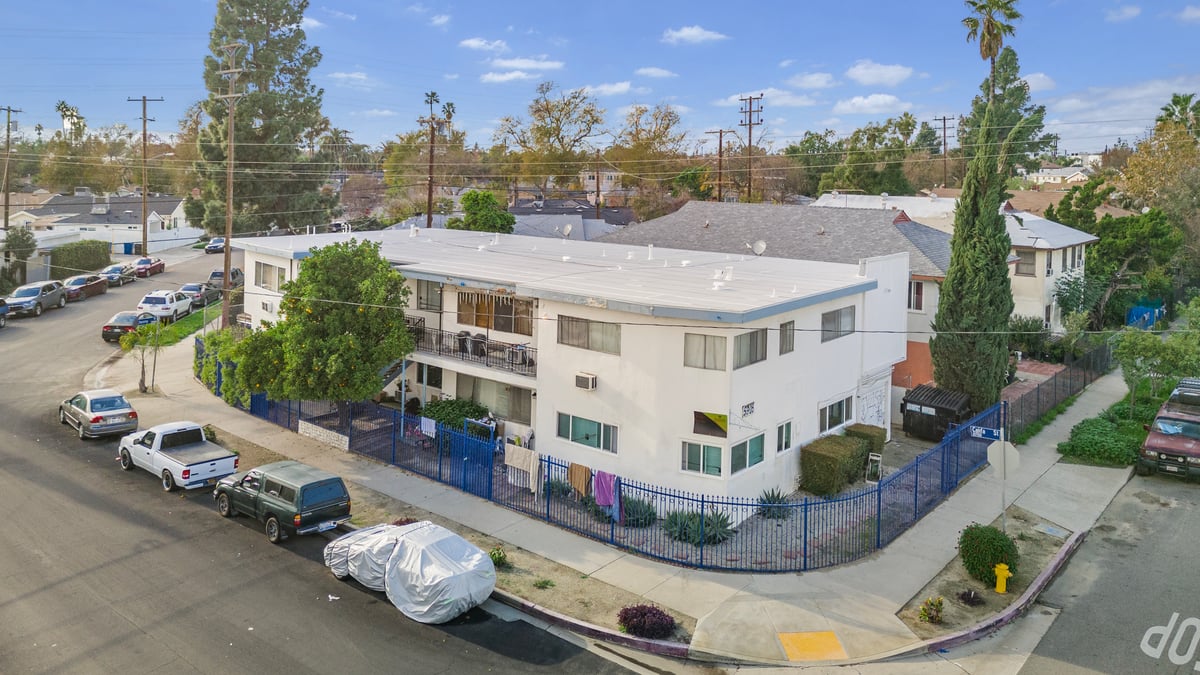
LAAA Team Closings in San Fernando Valley
206 transactions totaling $794.18M by Glen Scher, Filip Niculete & the LAAA Team
6860 Woodley Ave
Van Nuys • 2026
$1.72MUnits
7Cap
5.73%$/Unit
$245,000
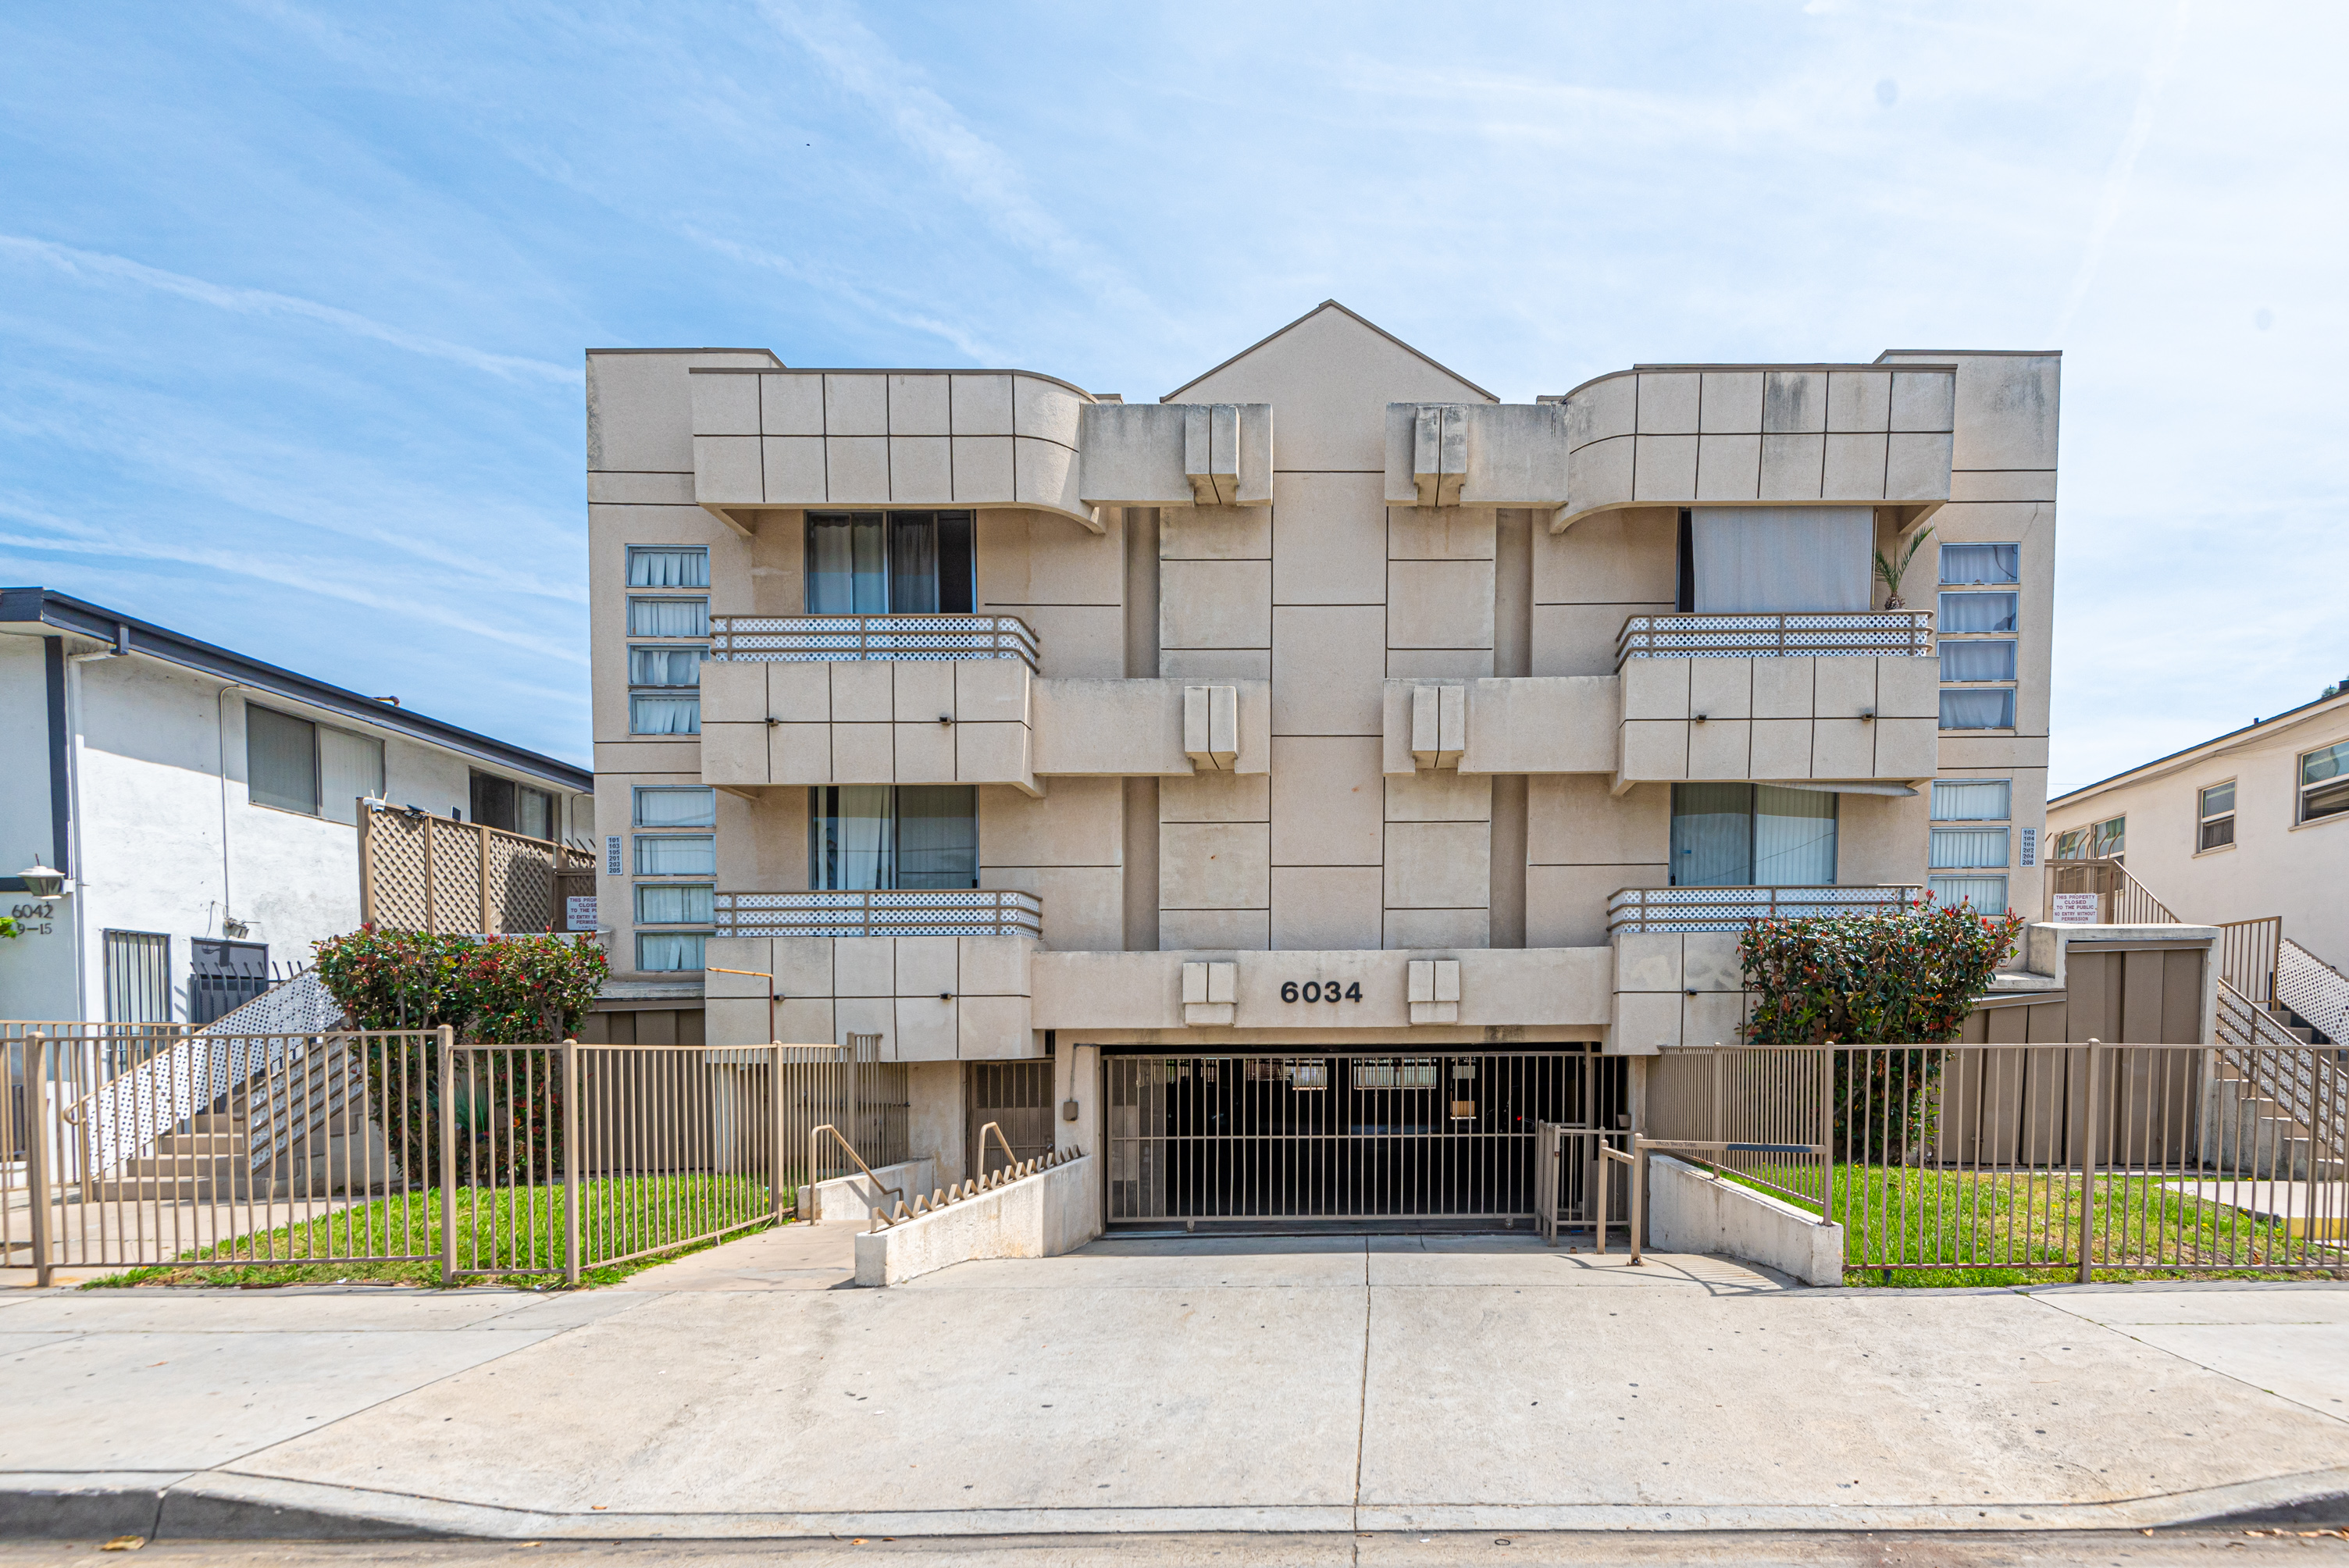
6034 Fulton Ave
Van Nuys • 2026
$2.91MUnits
12Cap
5.85%$/Unit
$242,500
5905 Whitnall Hwy
North Hollywood • 2026
$1.48MUnits
8Cap
5.88%$/Unit
$184,375
14932 Kittridge St
Van Nuys • 2026
$1.73MUnits
4Cap
4.10%$/Unit
$433,500
11700 Magnolia Blvd
Valley Village • 2025
$8.53MUnits
19Cap
6.22%$/Unit
$448,684
24966 Walnut St
Santa Clarita • 2025
$1.82MUnits
9Cap
5.32%$/Unit
$202,778
5917 Buffalo Ave
Van Nuys • 2025
$1.65MUnits
5Cap
6.30%$/Unit
$329,000
4637 Laurel Canyon Blvd
Valley Village • 2025
$5.15MUnits
5Cap
6.00%$/Unit
$1.03M
14015 Oxnard St
Van Nuys • 2025
$5.14MUnits
32Cap
7.56%$/Unit
$160,500
6716 Sylmar Ave
Van Nuys • 2025
$3.50MUnits
12Cap
6.34%$/Unit
$291,667
14658 Gilmore St
Van Nuys • 2025
$1.69M
12800 Oxnard St
North Hollywood • 2025
$1.13MUnits
3Cap
5.62%$/Unit
$375,000
3920 Knobhill Dr
Sherman Oaks • 2025
$3.92M
6228 Fulton Ave
Van Nuys • 2024
$8.74MUnits
30Cap
6.05%$/Unit
$291,333
10611 Landale St
North Hollywood • 2024
$1.40MUnits
5Cap
5.34%$/Unit
$280,000
11143 Aqua Vista St
North Hollywood • 2024
$2.30MUnits
10Cap
4.98%$/Unit
$230,000
12021 Hoffman St
Studio City • 2024
$1.50MUnits
5Cap
4.40%$/Unit
$299,000
5630 Fair Ave
North Hollywood • 2024
$7.63MUnits
15Cap
5.17%$/Unit
$508,333
5340 Ben Ave
Valley Village • 2024
$1.20MUnits
4Cap
2.67%$/Unit
$300,000
6311 Hazeltine Ave
Van Nuys • 2024
$915,000Units
4$/Unit
$228,750
Source: LAAA Team Closed Transactions
Recent Deal Stories
Our Active Listings in San Fernando Valley
 In Escrow
10425 Independence Ave
Land | 8 units
$2.50M
10898 Olinda St
Land | 78 units
$2.50M
7018 Alabama Ave
Multifamily | 9 units
$5.10M
14820 Moorpark St
Multifamily | 12 units
$4.25M
5321 Riverton Ave
Land | 27 units
$2M
Van Nuys AB 1482 Portfolio — 34 Units
Multifamily | 34 units
$8.95M
 In Escrow
5905 Whitnall Hwy
Multifamily | 8 units
$1.59M
12335 Osborne Pl
Land | 293 units
$4.25M
10814-10818 Blix St
Multifamily | 18 units
$4.50M
 In Escrow
20234 Roscoe Blvd
Multifamily | 25 units
$4.75M
 In Escrow
6860 Woodley Ave
Multifamily | 7 units
$1.85M
 In Escrow
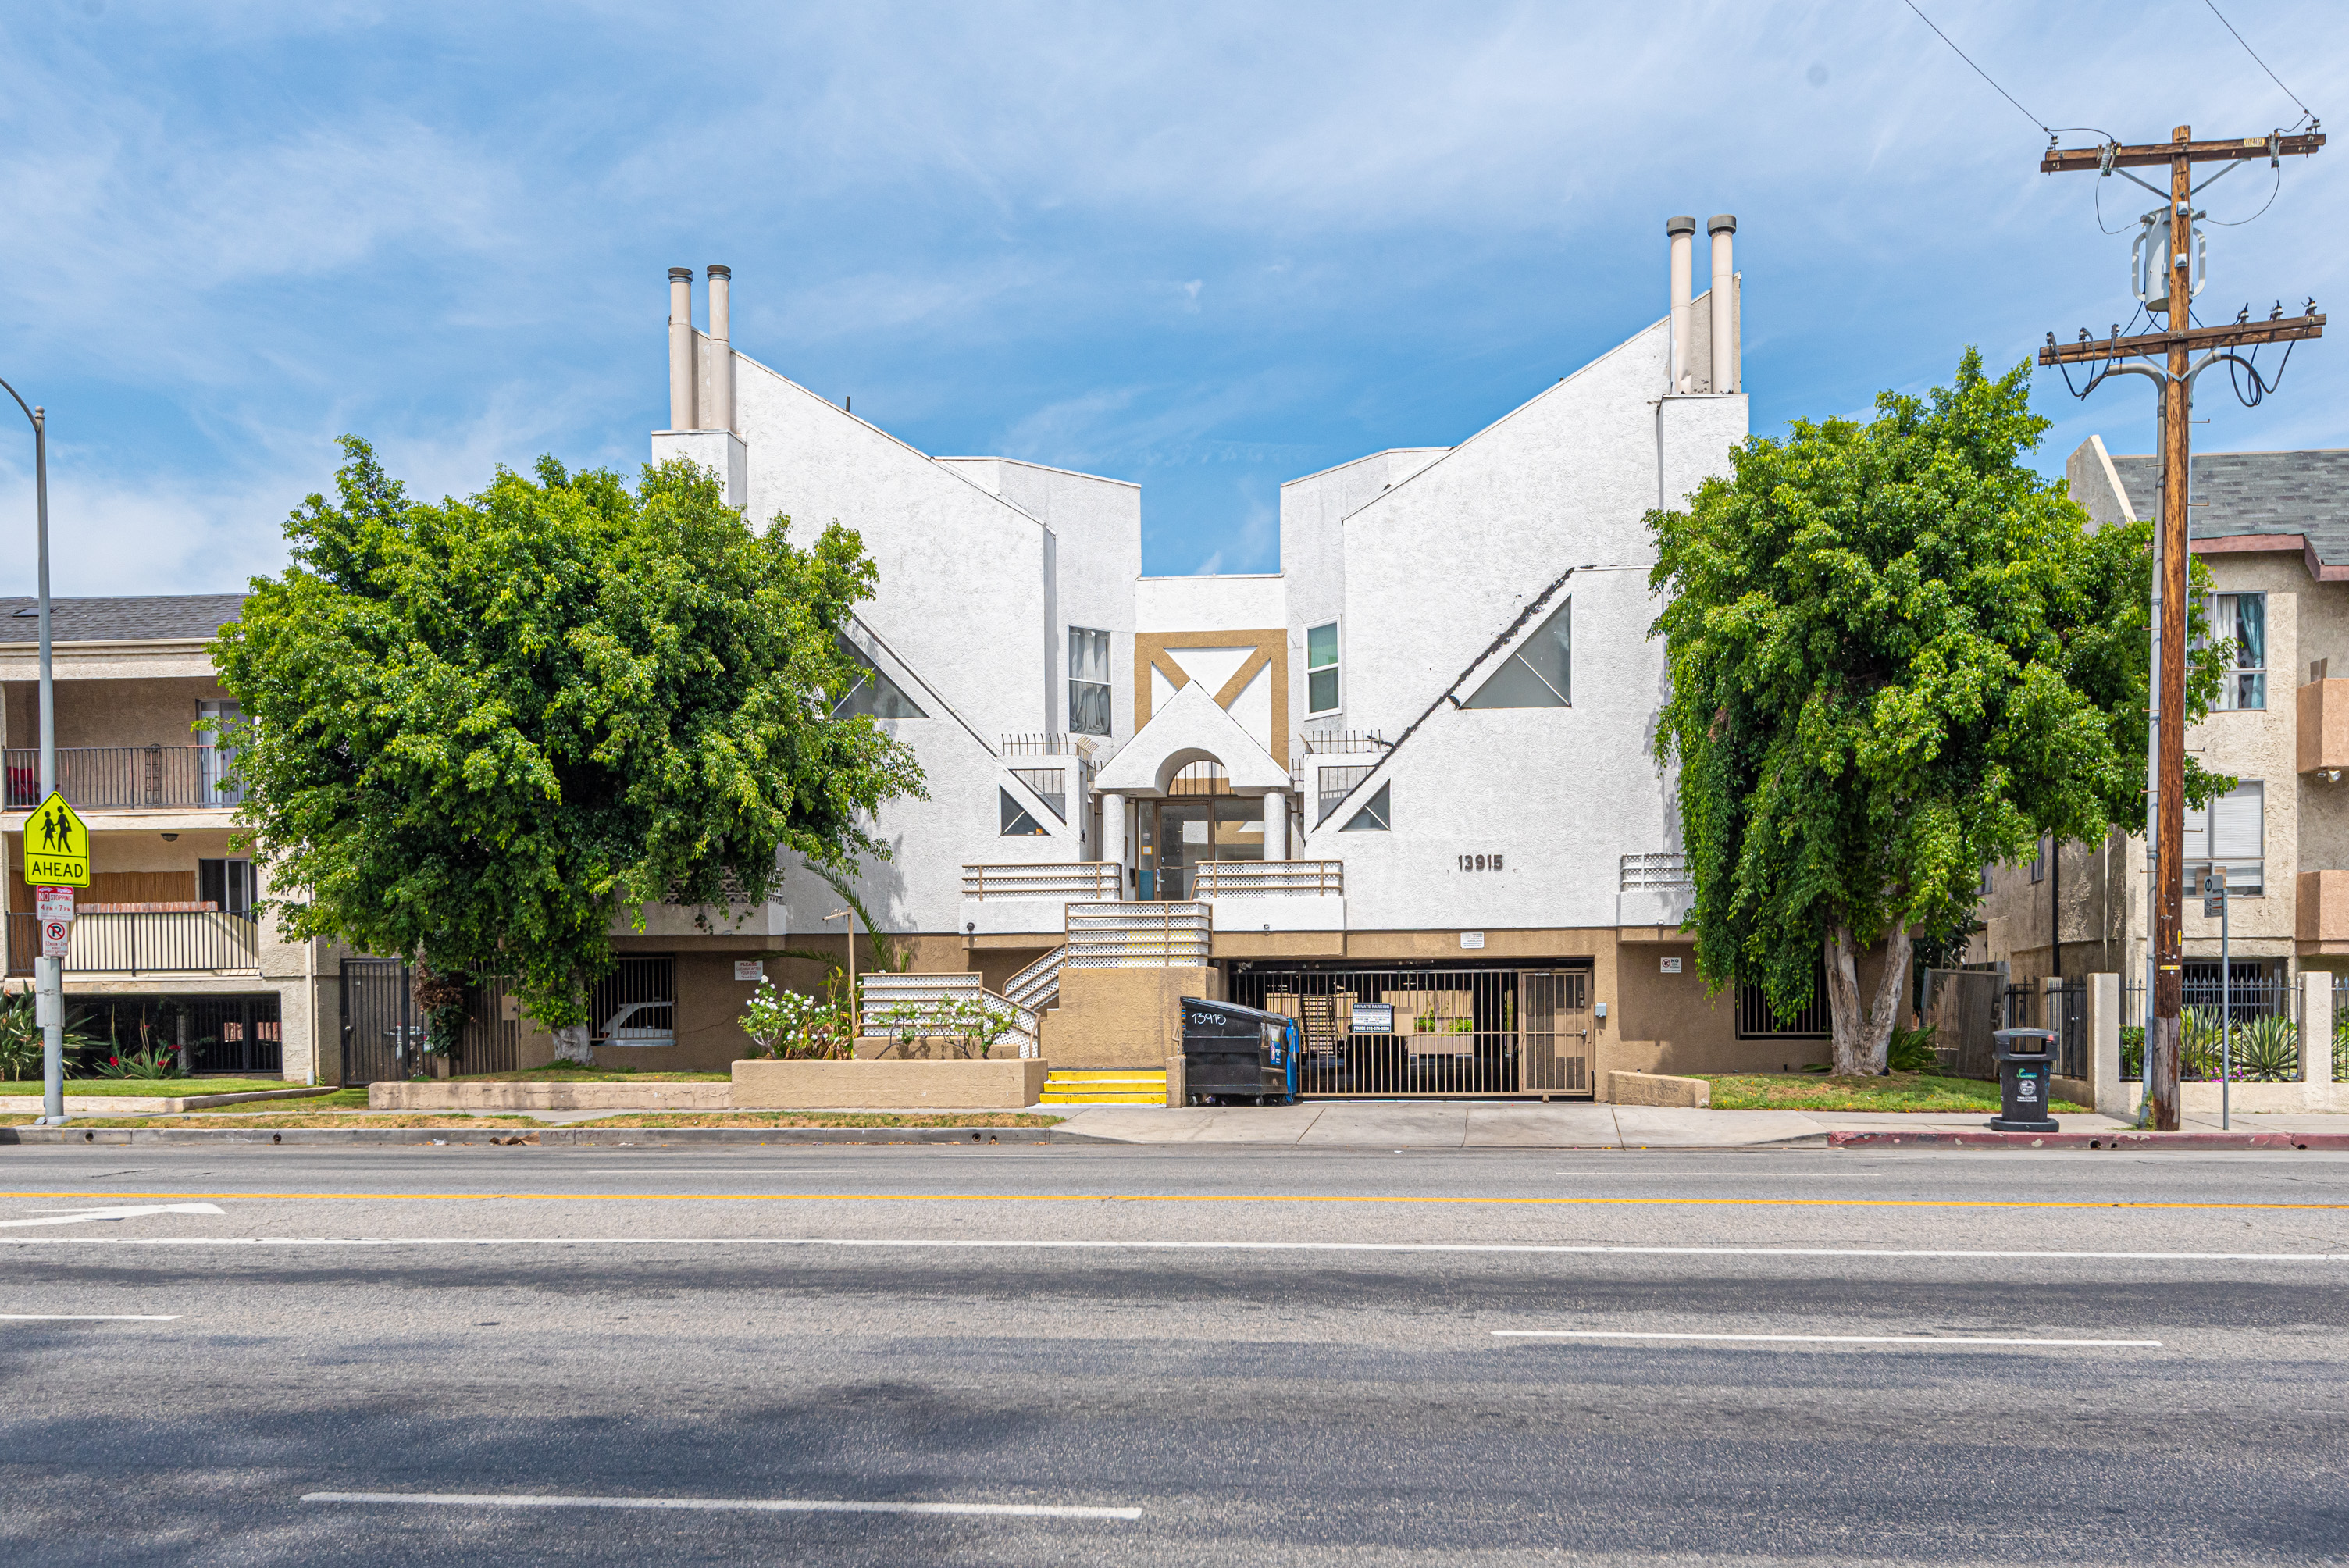
13915 Sherman Way
Multifamily | 15 units
$3.75M
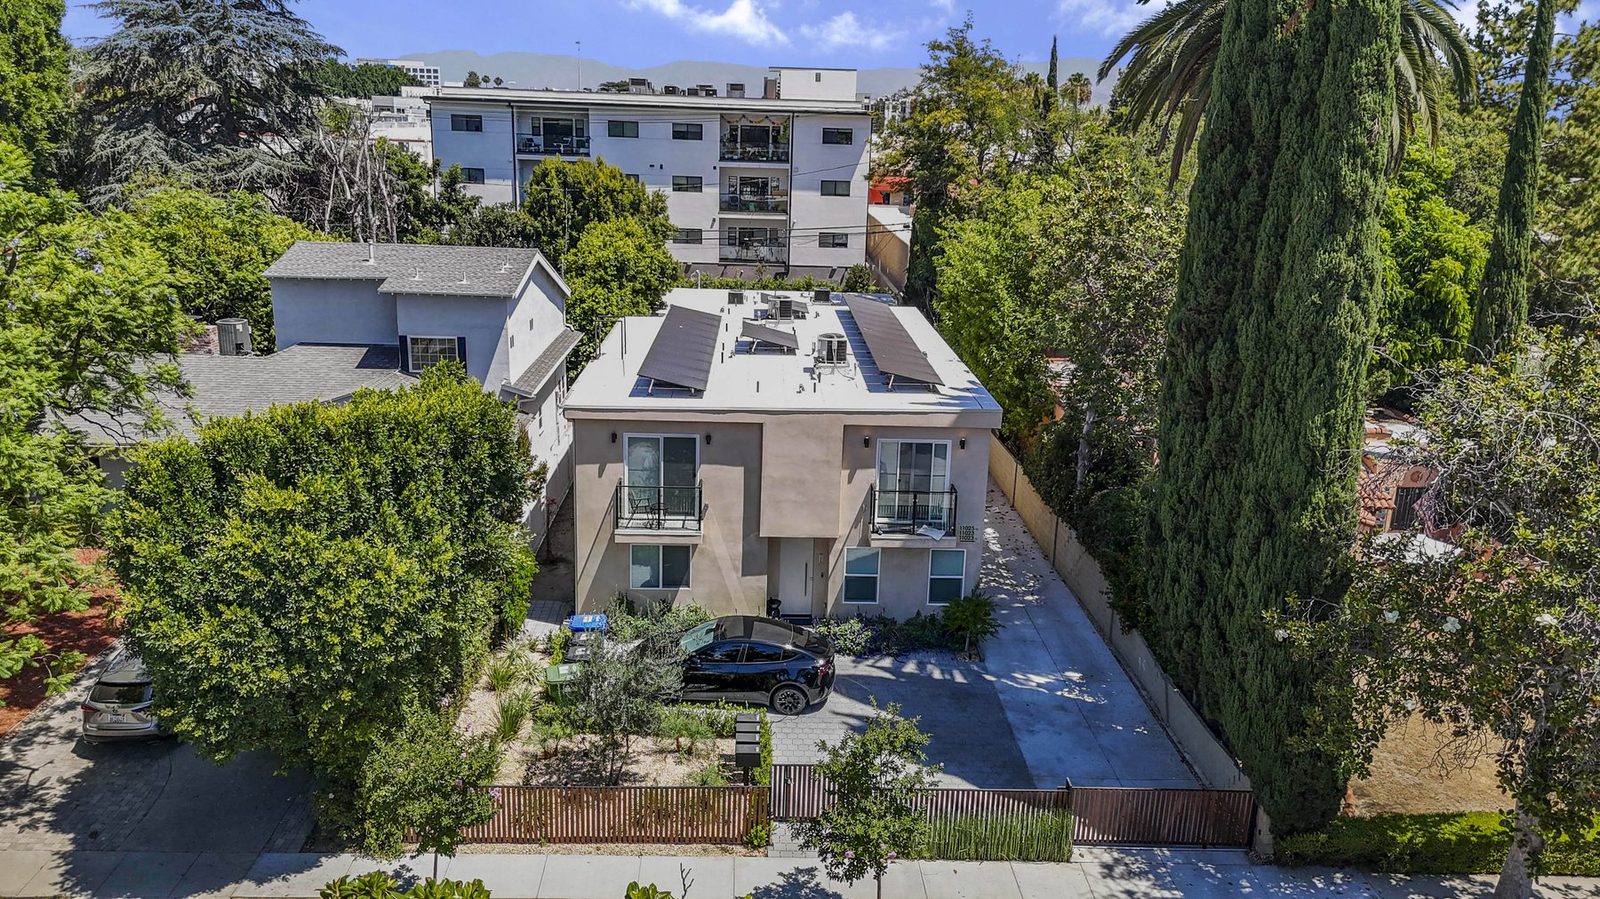
11025 Blix St
Multifamily | 4 units
$2.70M
5511 Ethel Ave
Land | 199 units
$9M
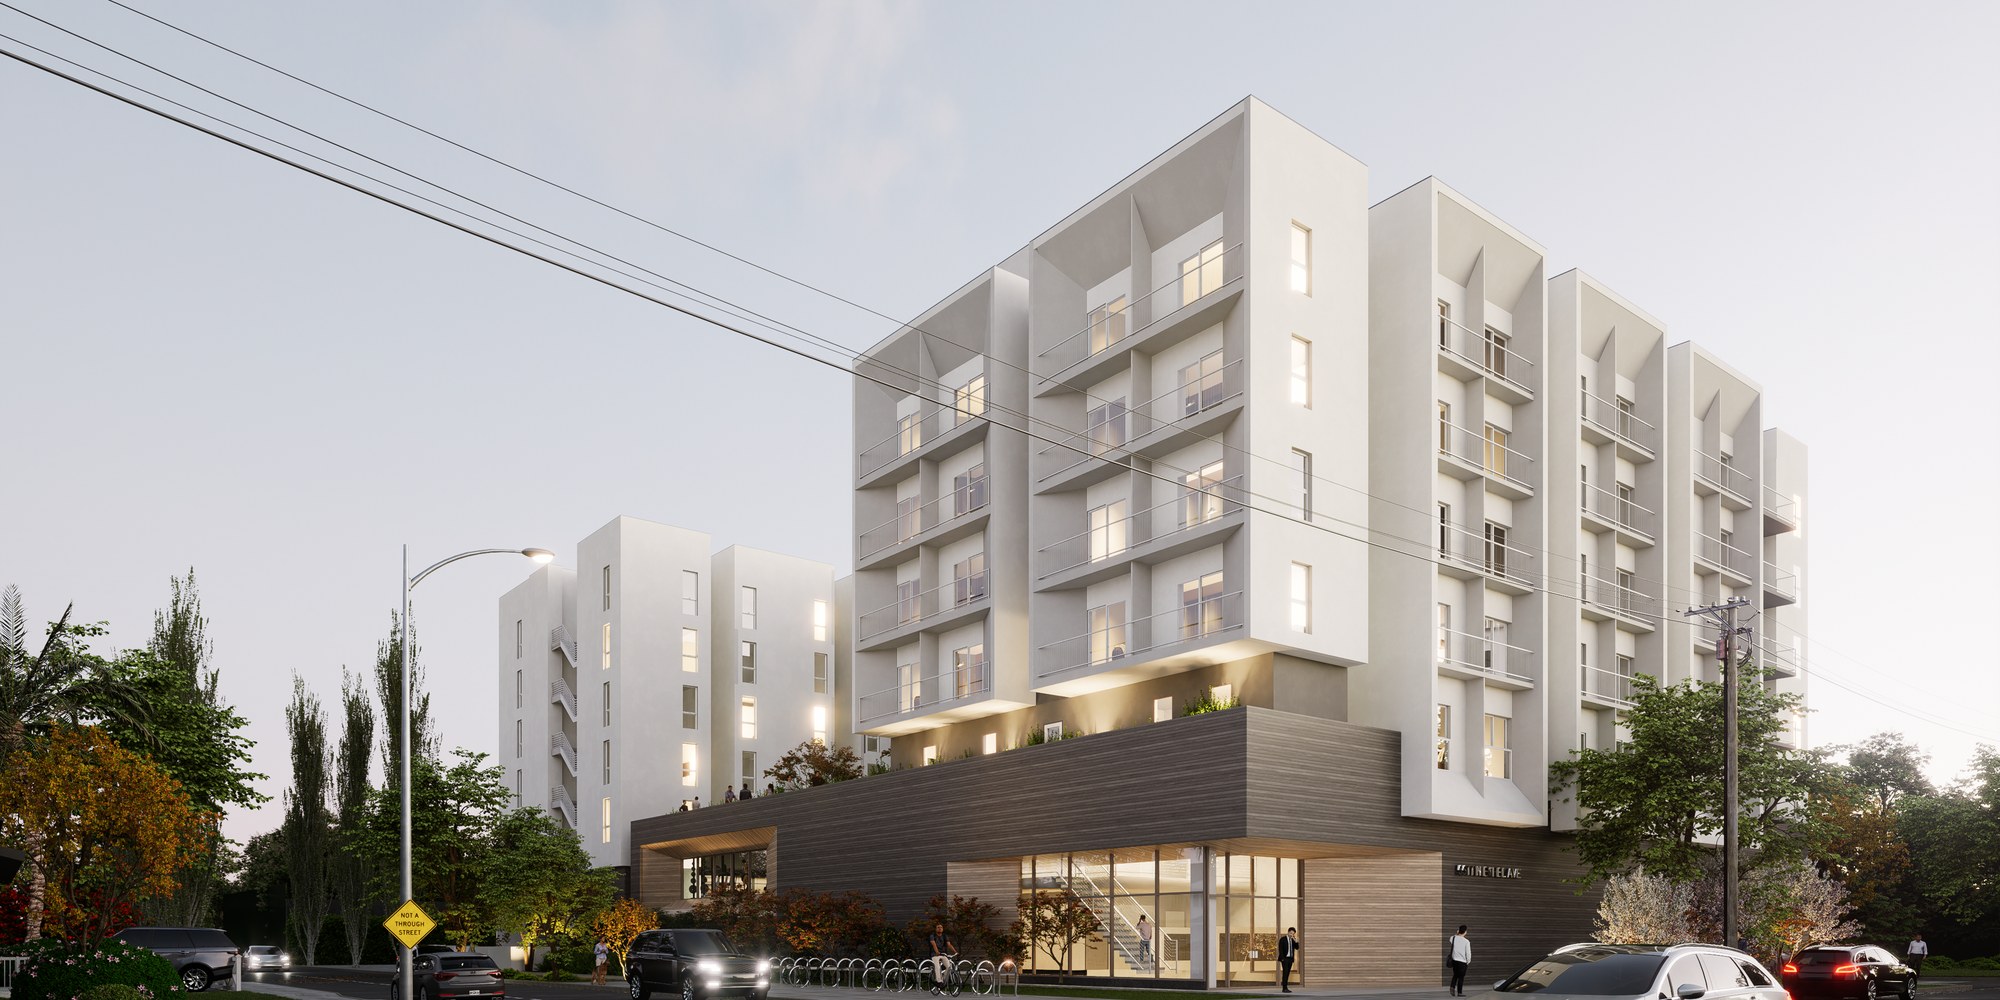
10455 Magnolia Blvd
Multifamily | 26 units
$9.20M
6901 Woodman Avenue
Land | 55 units
$1.50M
San Fernando Valley Multifamily Investment FAQs
Also Explore
What's Your San Fernando Valley Apartment Building Worth?
Get a complimentary Broker Opinion of Value from the LAAA Team.