Sherman Oaks Apartment Building Sales
Explore 28 closed multifamily transactions totaling $101.22M in Sherman Oaks. Data from the LAAA Team at Marcus & Millichap.
Request Free Valuation28
Transactions
$101.22M
Total Volume
4.06%
Avg Cap Rate
$333,382
Avg $/Unit
11
Avg Units
2013
Since
LAAA Team Track Record Since 2013
Sherman Oaks Multifamily Market Overview
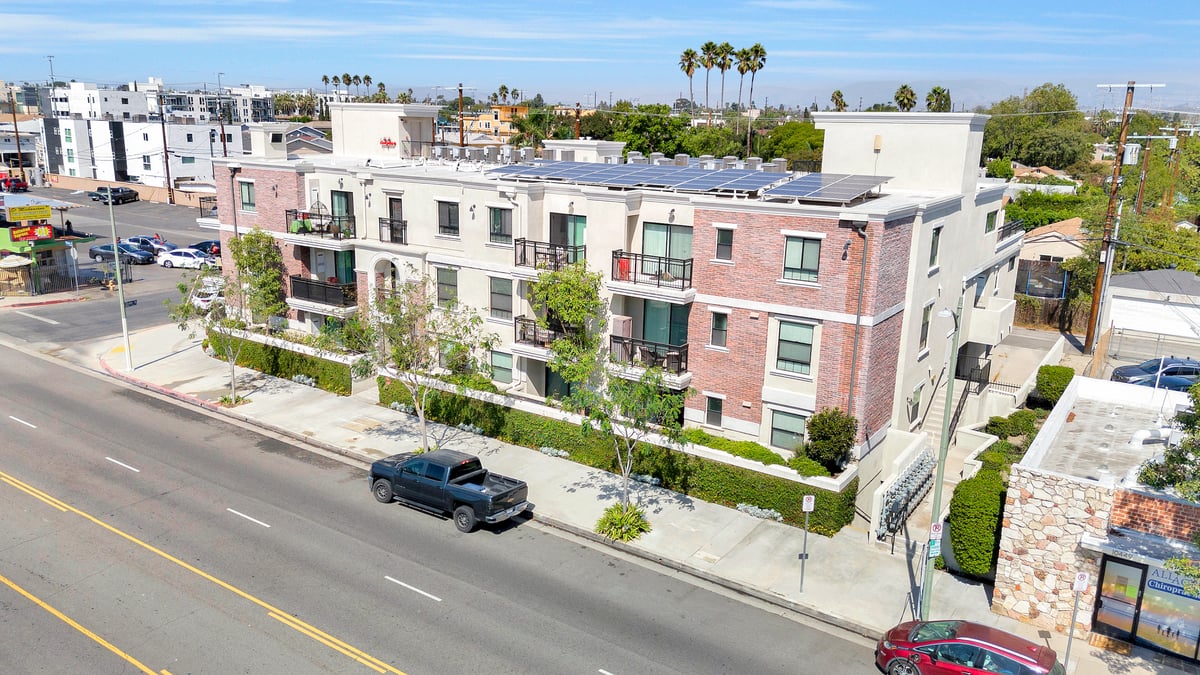
Sherman Oaks commands premium multifamily pricing along the Ventura Boulevard corridor, where affluent renters, strong schools, and tree-lined residential streets south of the boulevard create one of the Valley's most desirable apartment markets. Across 28 closed transactions totaling $101.2M in volume, the LAAA Team has documented an average cap rate of 4.06% and an average price per unit of $333K.
The core Sherman Oaks apartment market lies south of Ventura Boulevard toward Moorpark Street in the 91403 and 91423 zip codes, where 1960s and 1970s courtyard buildings on quiet residential streets attract young professionals and families drawn to the Ventura Boulevard dining and retail scene. Properties within walking distance of the boulevard command the highest per-unit pricing, routinely exceeding $350K per unit for well-maintained buildings.
North of Ventura Boulevard, larger garden-style complexes along Burbank Boulevard and Riverside Drive offer somewhat lower per-unit pricing with larger unit sizes that appeal to families. The entire Sherman Oaks market benefits from its central Valley location, proximity to the 101 and 405 freeways, and a perception as an "upgrade" neighborhood for tenants relocating from Van Nuys and North Hollywood.
Market Snapshot
Source: CoStar | Sherman Oaks Multifamily | 2026 Q1Rents by Unit Type
Investment Activity (Trailing 12 Mo)
Sherman Oaks Market Area
LAAA Team Closings in Sherman Oaks
28 transactions by Glen Scher, Filip Niculete & the LAAA Team
3920 Knobhill Dr
Sherman Oaks • 2025
$3.92M
4838-4846 Hazeltine Ave
Sherman Oaks • 2022
$6.10MUnits
16Cap
4.16%$/Unit
$381,250
14514 Benefit St
Sherman Oaks • 2022
$1.61MUnits
5Cap
3.30%$/Unit
$322,000
4500 Vista Del Monte Ave
Sherman Oaks • 2021
$1.75MUnits
5$/Unit
$349,000
4528 Vista Del Monte Ave
Sherman Oaks • 2021
$2.00MUnits
8Cap
3.17%$/Unit
$249,375
4334 Mammoth Ave
Sherman Oaks • 2020
$3.35MUnits
10Cap
5.56%$/Unit
$335,000
15028 Dickens St
Sherman Oaks • 2020
$5.55MUnits
20Cap
4.68%$/Unit
$277,500
14533 Dickens St
Sherman Oaks • 2020
$1.95MUnits
8Cap
4.65%$/Unit
$243,750
14826 Dickens St
Sherman Oaks • 2020
$1.88MUnits
6Cap
5.15%$/Unit
$312,500
4535 Murietta Ave
Sherman Oaks • 2020
$4.50MUnits
13Cap
4.46%$/Unit
$346,154
13312 Woodbridge St
Sherman Oaks • 2019
$1.45MUnits
5Cap
3.68%$/Unit
$289,000
4334 Mammoth Ave
Sherman Oaks • 2019
$3.33MUnits
10Cap
4.87%$/Unit
$333,000
13804 Moorpark St
Sherman Oaks • 2019
$1.27MUnits
6Cap
4.04%$/Unit
$211,667
14419 Riverside Dr
Sherman Oaks • 2019
$2.05M
4522 Murietta Ave
Sherman Oaks • 2018
$3.50MUnits
13Cap
3.85%$/Unit
$269,231
15028 Dickens St
Sherman Oaks • 2018
$3.17MUnits
10Cap
4.07%$/Unit
$316,500
4474 Murietta Ave
Sherman Oaks • 2018
$2.40MUnits
8Cap
3.66%$/Unit
$300,000
15058 Valleyheart Dr
Sherman Oaks • 2018
$660,000
4535 Murietta Ave
Sherman Oaks • 2017
$3.90MUnits
13Cap
3.87%$/Unit
$300,000
14224 Riverside Dr
Sherman Oaks • 2017
$5.45MUnits
9Cap
4.34%$/Unit
$605,556
Source: LAAA Team Closed Transactions
Recent Deal Stories


Our Active Listings in Sherman Oaks
Sherman Oaks Multifamily Investment FAQs
What's Your Sherman Oaks Apartment Building Worth?
Get a complimentary Broker Opinion of Value from the LAAA Team.