Glendale, Pasadena & Burbank Apartment Buildings: For Sale and Recently Sold
4 active listings and 53 closed transactions totaling $134.54M in the Glendale, Pasadena & Burbank market. Data from the LAAA Team at Marcus & Millichap.
Request Free Valuation53
Transactions
$134.54M
Total Volume
3.91%
Avg Cap Rate
$319,435
Avg $/Unit
8
Avg Units
2012
Since
Cap rate, price per unit and unit count are averaged across apartment sales only: 42 of these 53 closed transactions are apartment sales.
LAAA Team Track Record Since 2012
Glendale, Pasadena & Burbank Multifamily Market Overview
Glendale, Pasadena, and Burbank form a distinct multifamily investment corridor northeast of Downtown Los Angeles, anchored by three independent cities with their own regulatory environments. Across 53 closed transactions totaling $134.5M in volume, the LAAA Team has documented steady investor demand driven by entertainment industry employment, top-rated school districts, and walkable downtown cores.
Pasadena leads the submarket with 22 deals and $58.1M in sales volume. The areas along Colorado Boulevard, Lake Avenue, and Fair Oaks Avenue offer a mix of pre-war courtyard buildings and mid-century apartment complexes. South Pasadena, with its highly rated schools and charming downtown along Mission Street, commands premium pricing despite its small size. Pasadena voters approved Measure H in 2022, which places multifamily buildings built before February 1, 1995 under local rent stabilization: annual increases on covered units are capped at 75% of the change in the Los Angeles area CPI, owners register covered units with the city, and just-cause eviction rules apply.
Glendale's Brand Boulevard corridor and surrounding residential neighborhoods contain a diverse apartment stock ranging from 1940s courtyard buildings to newer mid-rise construction. Glendale is an independent city not subject to the LA RSO. AB 1482 sets its rent caps, and the city's Rental Rights Program adds just-cause eviction and relocation assistance rules. The city's Armenian-American community, strong retail corridor, and proximity to the Glendale Galleria support consistent rental demand.
Burbank's proximity to Walt Disney Studios, Warner Bros., and NBCUniversal creates a unique employment-driven rental market. With 13 deals and apartment sales averaging $372,731 per unit (among the highest in this submarket), Burbank's lower-density residential neighborhoods along Olive Avenue, Magnolia Boulevard, and near the Burbank Town Center attract tenants willing to pay premium rents for short commutes to entertainment jobs. Like Glendale, Burbank is independent of the LA RSO. AB 1482 sets its rent caps, and the city's tenant protection ordinance requires three months' rent in relocation assistance on a no-fault eviction.
Cap rates across the submarket's apartment sales average 3.91%, and individual sales vary with product type, from stabilized assets in South Pasadena to value-add opportunities in eastern Pasadena. Average price per unit across the submarket's apartment sales is $319,435, with Burbank commanding a significant premium.
What owners pay for insurance here: the 13 Glendale, Pasadena, Burbank and foothill buildings with a 2024 to 2026 premium in our deals and files paid a median $867 per unit a year, or $1.22 per square foot, as of October 2026. See the apartment building insurance guide.
Market Snapshot
Source: CoStar | Glendale Pasadena Burbank Multifamily | 2026 Q1Rents by Unit Type
Investment Activity (Trailing 12 Mo)
City Breakdown
Pasadena
22$58.07M volume
Avg cap: 4.09%
Avg $/unit: $300,727
View City →
Burbank
13$37.44M volume
Avg cap: 3.88%
Avg $/unit: $372,731
View City →
Glendale
5$8.57M volume
Avg cap: 3.36%
Avg $/unit: $320,990
View City →
South Pasadena
3$6.65M volume
Avg cap: 3.54%
Avg $/unit: $369,167
View City →
Pomona
3$10.39M volume
Avg cap: 5.80%
Avg $/unit: $161,292
View City →
Montrose
2$3.54M volume
Avg cap: 4.23%
Avg $/unit: $325,417
Monrovia
2$2.95M volume
Avg cap: 3.32%
Avg $/unit: $274,555
La Cañada Flintridge
1$1.28M volume
Avg cap: 3.70%
Avg $/unit: $426,667
La Crescenta
1$2.55M volume
Avg cap: 2.62%
Avg $/unit: $283,333
Altadena
1$3.10M volume
Avg cap: 3.89%
Avg $/unit: $182,353
Glendale, Pasadena & Burbank Market Area
LAAA Team Closings in Glendale, Pasadena & Burbank
53 transactions totaling $134.54M by Glen Scher, Filip Niculete & the LAAA Team
4306-4310 W Victory Blvd
Burbank • 2026
$1,360,000Units
3$/Unit
$453,333
2907 W Riverside Drive
Burbank • 2026
$1,590,000Units
4Cap
4.37%$/Unit
$397,500
4503 Castle Lane
La Cañada Flintridge • 2026
$1,280,000Units
3Cap
3.70%$/Unit
$426,667
4123 Ocean View Blvd
Montrose • 2026
$1,685,000Units
6Cap
4.94%$/Unit
$280,833
157 W Ash Ave
Burbank • 2023
$2,425,000Units
5Cap
4.78%$/Unit
$485,000
1027 Grover Ave
Glendale • 2023
$3,065,000Units
8Cap
4.40%$/Unit
$383,125
4318 W Victory Blvd
Burbank • 2023
$2,000,000Units
1Cap
4.90%$/Unit
$2,000,000
336-342 E Providencia Ave
Burbank • 2023
$7,050,000Units
24Cap
4.93%$/Unit
$293,750
328 E Providencia Ave
Burbank • 2023
$5,175,000Units
11Cap
4.48%$/Unit
$470,455
400 S Mentor Ave
Pasadena • 2023
$7,500,000Units
21Cap
4.41%$/Unit
$357,143
157 W Ash Ave
Burbank • 2022
$2,210,000Units
5Cap
3.58%$/Unit
$442,000
260 Linda Rosa Ave
Pasadena • 2021
$2,350,000Units
7Cap
4.06%$/Unit
$335,714
244 W Walnut Ave
Monrovia • 2021
$1,441,440Units
4Cap
3.12%$/Unit
$360,360
181 Monterey Rd
South Pasadena • 2021
$2,600,000
934 N Lake Ave
Pasadena • 2021
$1,433,000Units
6Cap
3.22%$/Unit
$238,833
2310 Montrose Ave
Montrose • 2020
$1,850,000Units
5Cap
3.52%$/Unit
$370,000
827 E Washington
Pasadena • 2020
$2,400,000Units
8Cap
5.79%$/Unit
$300,000
940 N Summit Ave
Pasadena • 2020
$1,225,000Units
3Cap
4.90%$/Unit
$408,333
130 S Euclid Ave
Pasadena • 2019
$4,575,000Cap
5.19%
106 N Allen Ave
Pasadena • 2019
$1,325,000Units
5Cap
5.33%$/Unit
$265,000
332 Pasadena Ave
South Pasadena • 2019
$1,900,000Units
5Cap
3.42%$/Unit
$380,000
913 Boston Ct
Pasadena • 2019
$1,600,000
759 N Raymond Ave
Pasadena • 2019
$1,050,000Units
5Cap
4.84%$/Unit
$210,000
120 N Bonnie Ave
Pasadena • 2019
$1,700,000Units
6Cap
3.35%$/Unit
$283,333
603 Mound Ave
South Pasadena • 2019
$2,150,000Units
6Cap
3.66%$/Unit
$358,333
805 W Glenoaks Blvd
Glendale • 2019
$1,040,000Units
3Cap
2.68%$/Unit
$346,667
1300 W Mission Blvd
Pomona • 2019
$1,050,000
2047 N Raymond Ave
Pasadena • 2019
$1,650,000Units
4Cap
4.23%$/Unit
$412,500
55 Arlington Dr
Pasadena • 2019
$3,600,000Units
8Cap
4.20%$/Unit
$450,000
435 S Hudson Ave
Pasadena • 2019
$3,500,000Units
9Cap
4.10%$/Unit
$388,889
1443 E Maple St
Glendale • 2019
$1,575,000Units
6Cap
3.75%$/Unit
$262,500
1833 N Garey Ave
Pomona • 2018
$1,600,000
243 W Colorado Blvd
Monrovia • 2018
$1,510,000Units
8Cap
3.51%$/Unit
$188,750
233 S Euclid Ave
Pasadena • 2018
$12,500,000Cap
3.13%
237 Thompson Ave
Glendale • 2018
$1,750,000Units
6Cap
2.59%$/Unit
$291,667
837 N El Molino Ave
Pasadena • 2018
$2,050,000Units
6Cap
4.65%$/Unit
$341,667
139 S Rosemead Blvd
Pasadena • 2018
$1,125,000Units
6Cap
2.72%$/Unit
$187,500
180 S Rosemead Blvd
Pasadena • 2018
$1,750,000
340 S Madison Ave
Pasadena • 2018
$2,025,000Units
6Cap
6.33%$/Unit
$337,500
401 S Flower St
Burbank • 2018
$1,600,000Cap
4.00%
632 Irving Ave
Glendale • 2017
$1,145,000Cap
1.25%
2806 Piedmont Ave
La Crescenta • 2017
$2,550,000Units
9Cap
2.62%$/Unit
$283,333
1388 E Orange Grove Blvd
Pasadena • 2017
$1,100,000Units
4Cap
3.83%$/Unit
$275,000
1213 North Screenland Drive
Burbank • 2017
$1,800,000Units
6Cap
3.01%$/Unit
$300,000
837 N El Molino Ave
Pasadena • 2017
$1,000,000Units
6Cap
1.92%$/Unit
$166,667
143 N Maple St
Burbank • 2017
$1,475,000Units
4Cap
3.54%$/Unit
$368,750
703 East Providencia Avenue
Burbank • 2016
$1,970,000Units
10Cap
3.00%$/Unit
$197,000
940 North Summit Avenue
Pasadena • 2016
$615,000Units
3Cap
2.85%$/Unit
$205,000
422 South Lake Street
Burbank • 2016
$7,250,000Units
14Cap
3.13%$/Unit
$517,857
755 East Pine Street
Altadena • 2015
$3,100,000Units
17Cap
3.89%$/Unit
$182,353
55 Arlington Drive
Pasadena • 2015
$2,000,000Units
8Cap
2.91%$/Unit
$250,000
2501 North Glenoaks Boulevard
Burbank • 2015
$1,530,000Units
6Cap
3.99%$/Unit
$255,000
3420 Falcon Street
Pomona • 2013
$7,742,000Units
48Cap
5.80%$/Unit
$161,292
Source: LAAA Team Closed Transactions
Recent Deal Stories
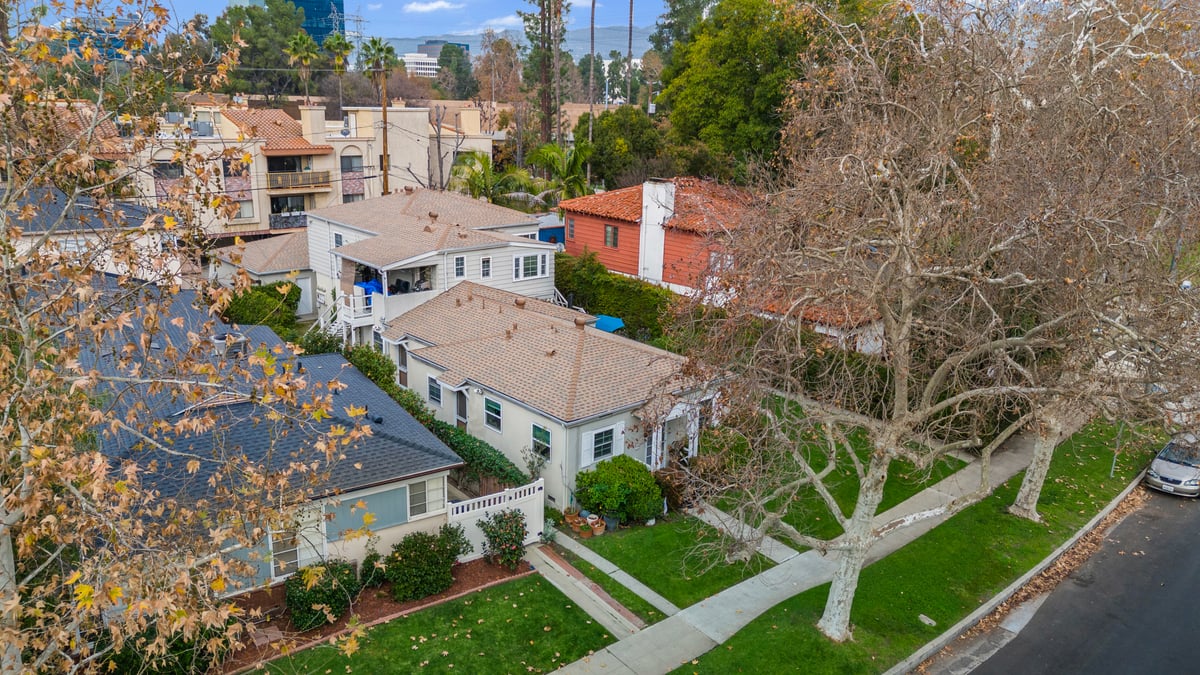
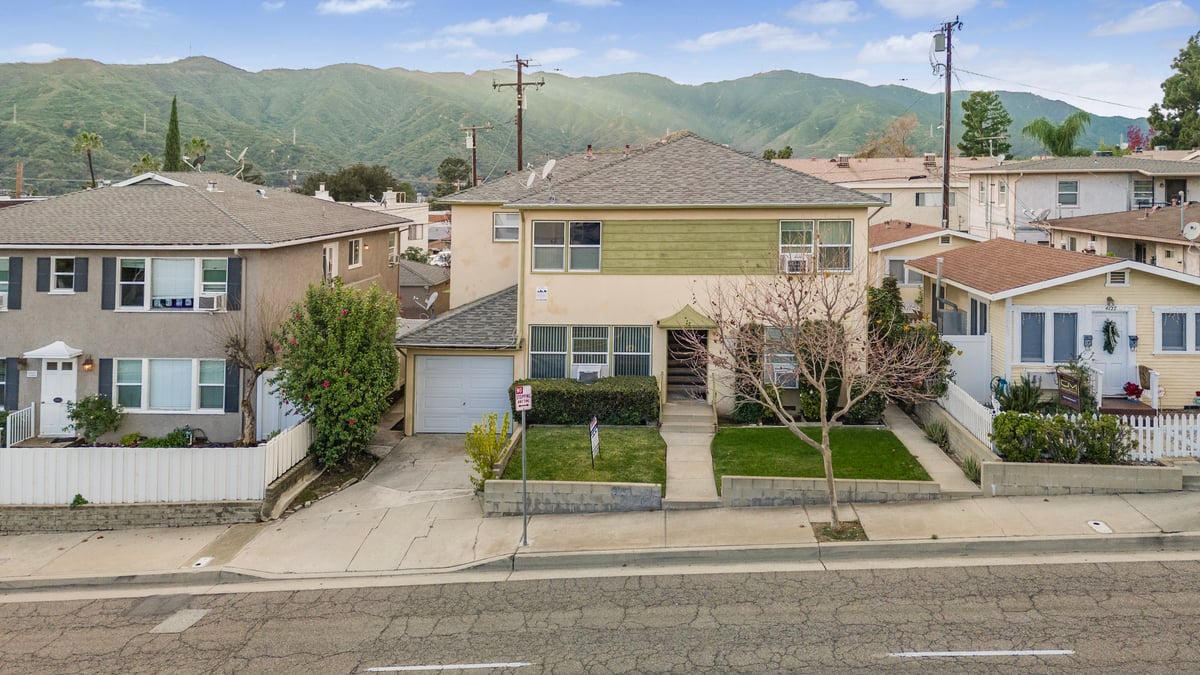

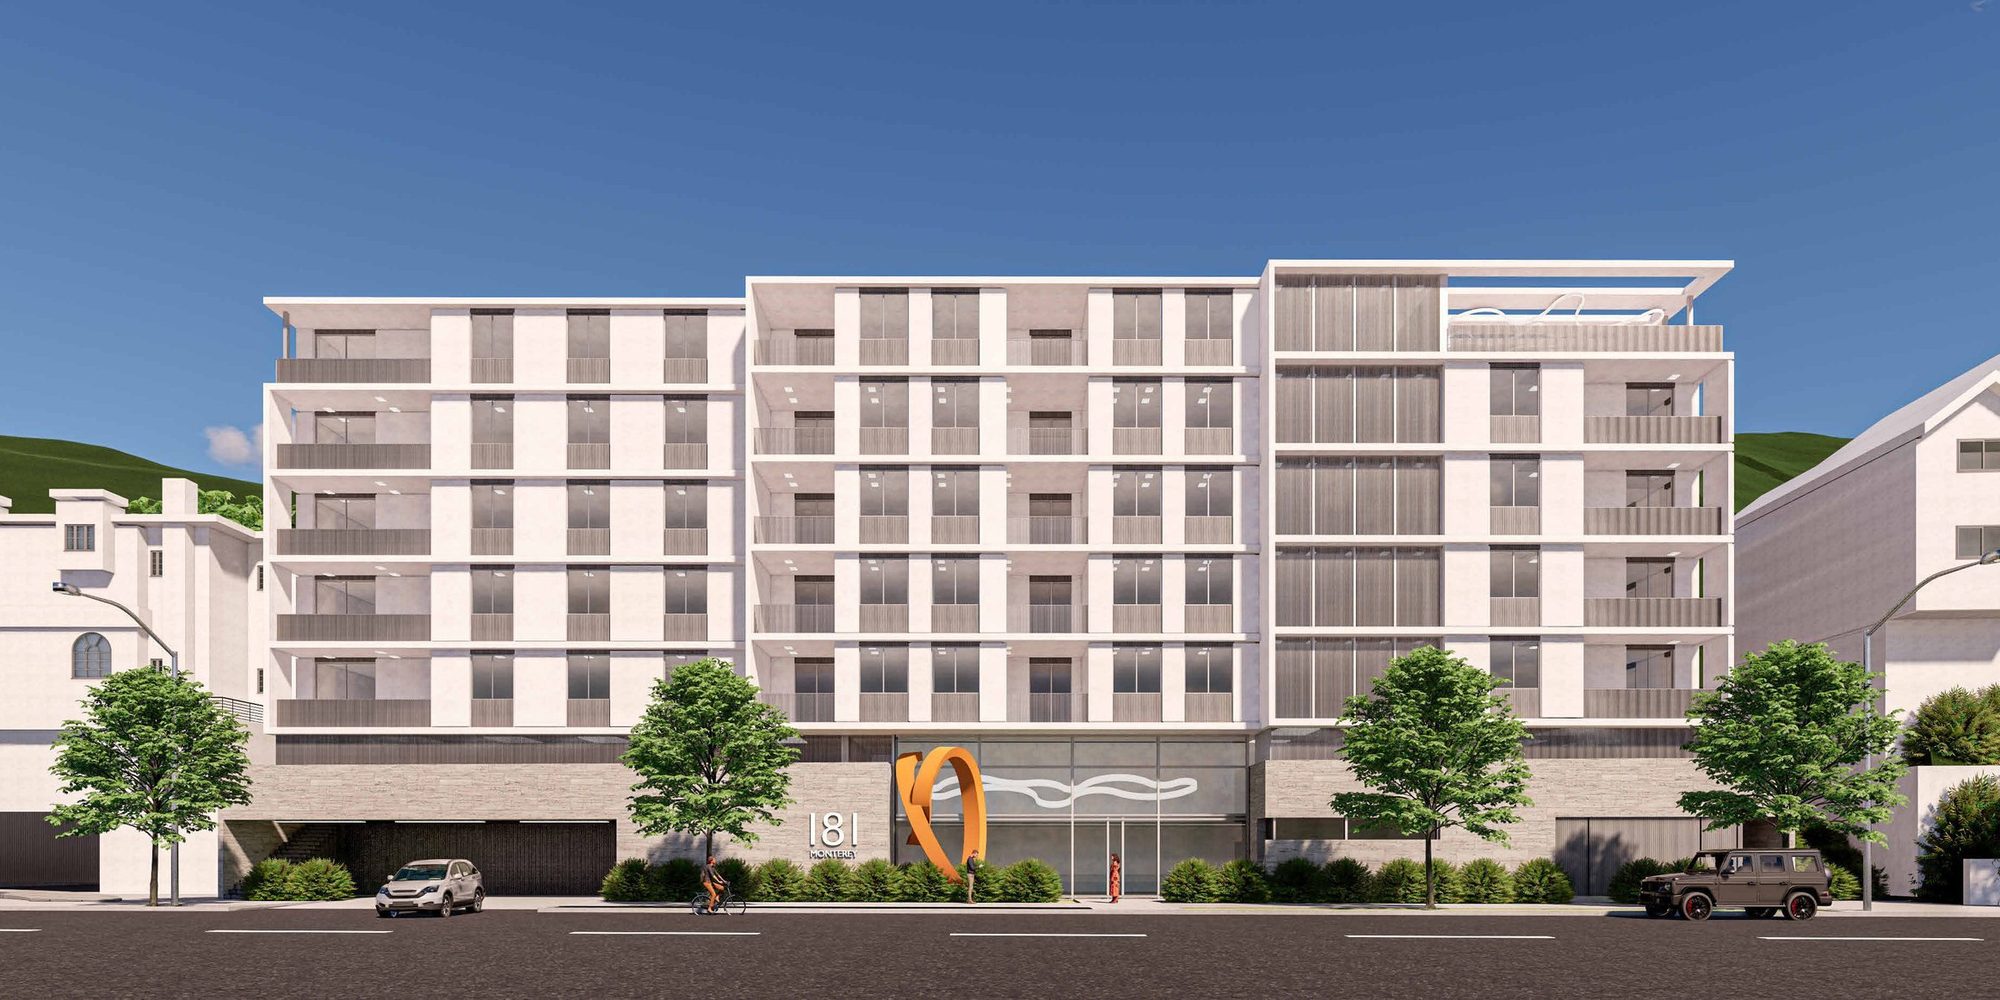
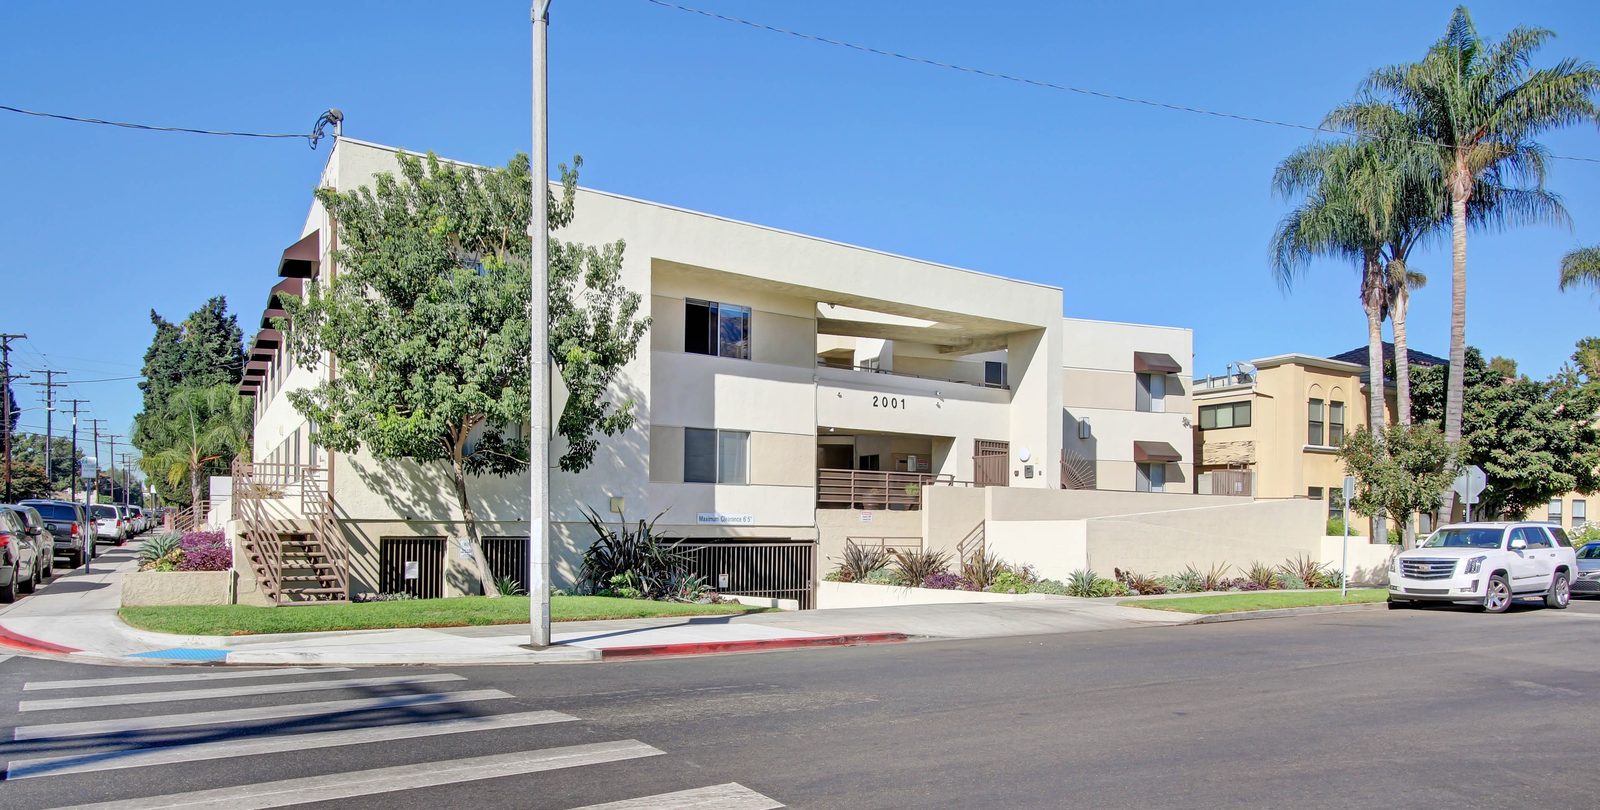
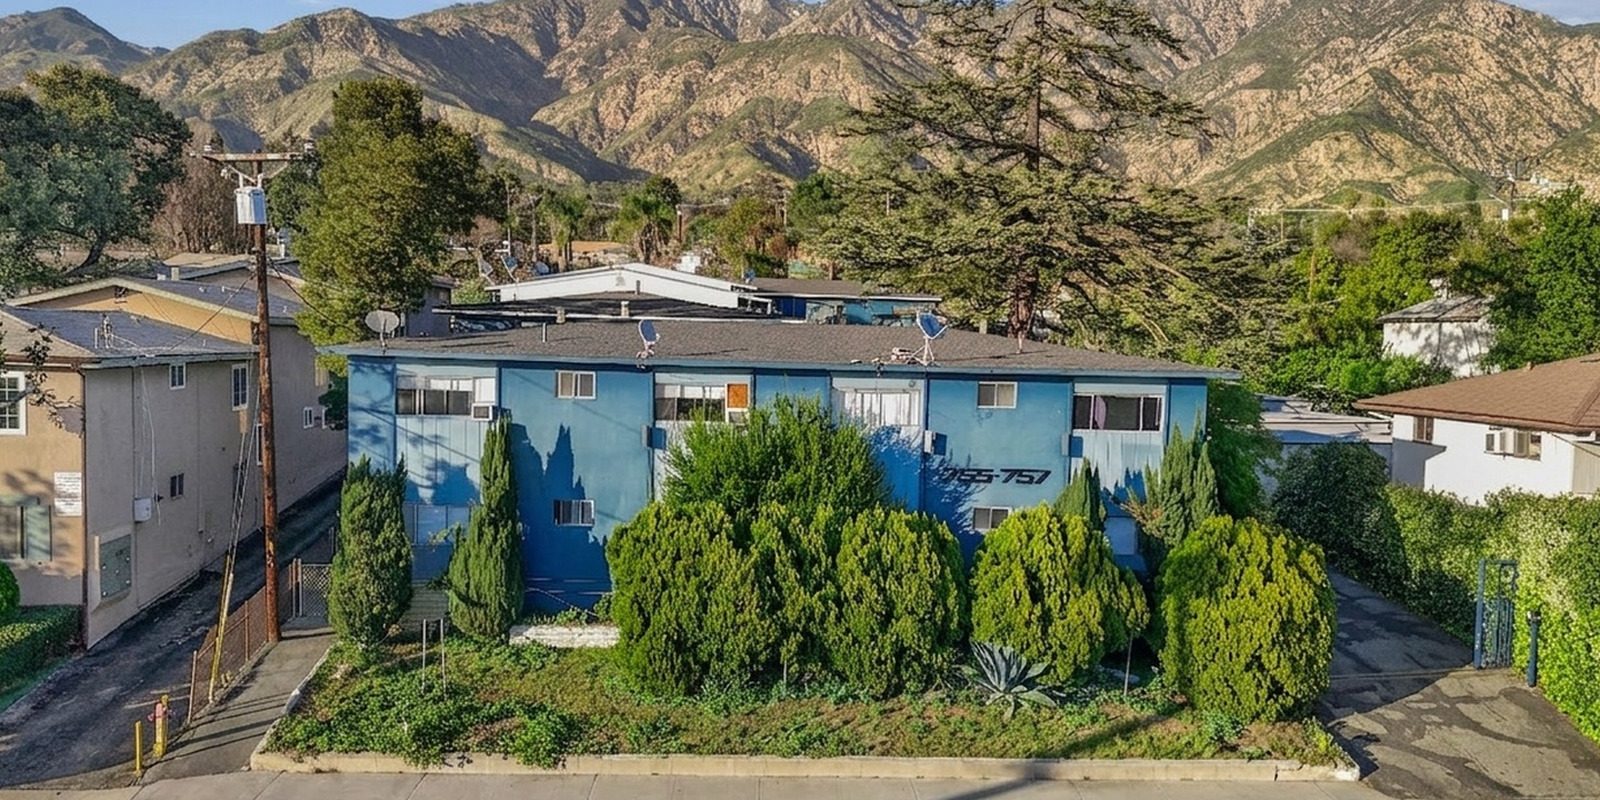
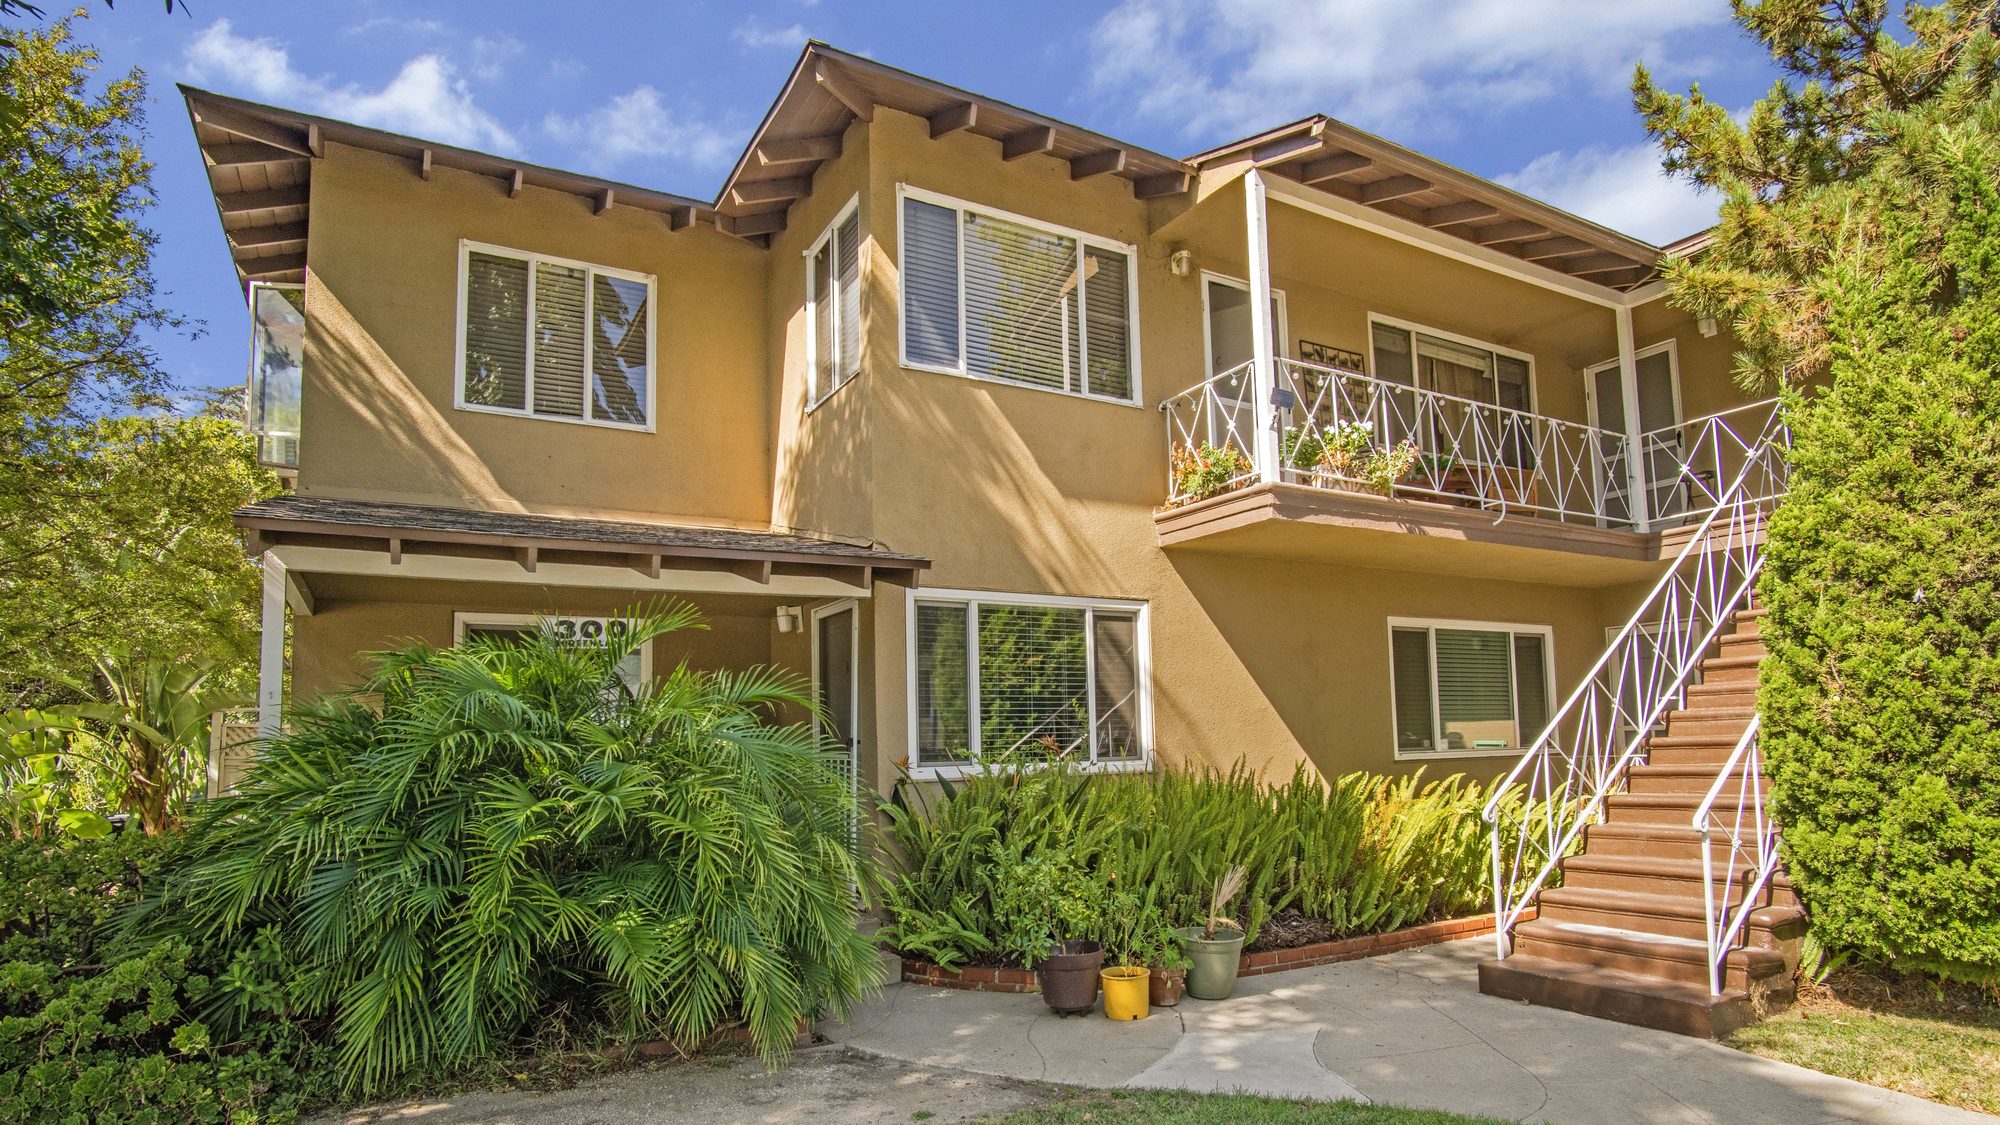
Our Active Listings in Glendale, Pasadena & Burbank
Glendale, Pasadena & Burbank Multifamily Investment FAQs
Apartment buildings in the GPB corridor average $319,435 per unit across the apartment sales within 53 closed transactions. Burbank ranks among the highest at $372,731 per unit due to entertainment industry proximity, while Pasadena averages $300,727 per unit and Glendale trades at competitive market rates. South Pasadena's school district premium pushes pricing above the submarket average.
Cap rates in the GPB submarket average 3.91% across the 42 apartment sales with a recorded cap rate within 53 closed transactions. Pasadena averages 4.09%, while Burbank averages 3.88%. Stabilized assets in prime locations trade at 3.5-4.5%, while value-add opportunities in eastern Pasadena can offer 5-6% going-in yields with upside potential.
Glendale, Pasadena, and Burbank are independent cities not subject to the Los Angeles RSO, and their rules differ. Pasadena has its own rent stabilization under Measure H, approved by voters in 2022: multifamily buildings built before February 1, 1995 are limited to annual increases of 75% of the change in the Los Angeles area CPI, set each year by the city's Rental Housing Board, with a rental registry and just-cause eviction rules. Glendale and Burbank rely on AB 1482 for rent caps (5% plus CPI, max 10%, for buildings 15+ years old). Glendale's Rental Rights Program adds just-cause eviction and relocation assistance rules, and Burbank requires three months' rent in relocation assistance on a no-fault eviction.
The GPB corridor benefits from unique demand drivers that insulate it from broader market cycles. Burbank's entertainment studios (Disney, Warner Bros., NBCUniversal) generate steady high-income rental demand. Pasadena's Caltech, JPL, Art Center, and Old Town retail corridor attract diverse tenant pools. Glendale's strong Armenian-American community and retail economy support consistent occupancy. All three cities sit outside the City of Los Angeles, so neither the LA RSO nor the Measure ULA transfer tax applies, though Pasadena has its own rent stabilization under Measure H.
The LAAA Team has closed 53 transactions totaling $134.5M in the GPB corridor since 2012. Pasadena leads with 22 deals ($58.1M), followed by Burbank (13 deals, $37.4M), Glendale (5 deals), South Pasadena (3 deals), and Pomona (3 deals, $10.4M). The team's experience spans the full range of product from small 4-unit buildings to larger institutional-quality assets.
The GPB submarket features a wide range of apartment stock: 1920s-1940s courtyard buildings in South Pasadena and central Pasadena, 1950s-1960s garden-style complexes along Colorado Boulevard and Brand Boulevard, and newer infill construction near Metro Gold Line stations. Building sizes range from 4-unit fourplexes to 30+ unit complexes. Burbank's stock tends toward smaller, lower-density buildings in residential neighborhoods, while Pasadena offers both small and mid-size complexes.
Also Explore
What's Your Glendale, Pasadena & Burbank Apartment Building Worth?
Get a complimentary Broker Opinion of Value from the LAAA Team.